Trading glossary / RSI indicator
RSI Indicator on Quotex: Settings, 30/70 Levels and Signals
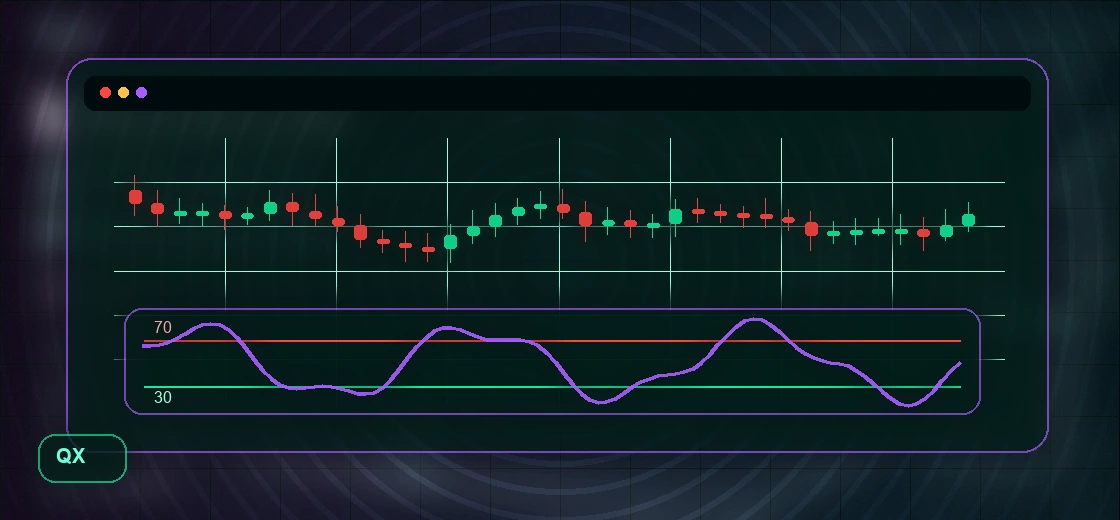
The Relative Strength Index measures recent momentum on a scale from 0 to 100. RSI can help a trader see pressure and changing speed, but an overbought or oversold reading is a condition, not an automatic reversal signal.
Practise the term on Quotex
Open demo first, keep the trade amount small and use real money only when the term is clear in a live chart context.
What it means
RSI, or Relative Strength Index, compares the strength of recent upward and downward price changes. The standard setting uses 14 periods and plots a line between 0 and 100. Readings above 70 are commonly called overbought and readings below 30 oversold, but price can remain in either zone during a strong trend.
Why traders watch it
Traders use RSI to judge momentum, compare pullbacks and spot moments when price and momentum stop agreeing. Its value comes from context. RSI near 70 in a strong uptrend may confirm strength, while the same reading near major resistance after an extended move may support a more cautious view.
How to practise it
Open a demo chart with the standard 14-period RSI. Mark the trend and support or resistance first, then record how RSI behaves during pullbacks, breakouts and ranges. Test one rule at a time, such as waiting for RSI to leave an extreme zone only when price also confirms at a level.
How to read RSI on Quotex
What the RSI number actually says
RSI describes the balance of recent gains and losses. A rising line shows strengthening upward momentum; a falling line shows strengthening downward momentum. It does not show whether price is cheap or expensive, and it does not know where the next candle will close.
Use the standard setting before custom settings
The common RSI setting is 14 periods. Shorter settings react faster but produce more noise, while longer settings react more slowly. Beginners gain more from learning one stable setting than from searching for a perfect number after every loss.
Overbought does not mean sell
An RSI reading above 70 shows strong recent upward pressure. In a powerful uptrend, the indicator can stay high while price continues rising. A sell idea needs additional evidence such as a clear resistance zone, weakening price action or failed continuation.
Oversold does not mean buy
A reading below 30 shows strong recent downward pressure, not a guaranteed bottom. Price can keep falling while RSI remains low. Look for support, a change in candle behaviour and confirmation that sellers are actually losing control.
Read RSI differently in trends and ranges
In a range, moves toward 30 and 70 can help describe the edges, especially when price reaches support or resistance. In a trend, pullbacks may turn before the classic extremes. The market structure should decide how the RSI reading is interpreted.
Divergence is a warning, not a trigger
Bullish divergence appears when price makes a lower low while RSI makes a higher low; bearish divergence is the opposite. Divergence suggests momentum is changing, but price can continue in the old direction. Wait for a level, break or candle confirmation before considering action.
Combine RSI with price, not more indicators
Adding many indicators that measure similar momentum often creates false confidence. A cleaner routine combines RSI with price structure, support and resistance, and one clear risk rule. The indicator should answer a specific question, not decorate the chart.
Match the indicator to expiry timing
RSI can react to a move after it has already started. If expiry is too short, normal fluctuation may decide the result before the broader idea develops. Observe how the indicator and price behave across several candles, then test the timing on demo.
Common RSI mistakes
The most common errors are selling every reading above 70, buying every reading below 30, forcing divergence, changing settings constantly and ignoring news-driven volatility. Each mistake treats the indicator as a prediction tool instead of a momentum filter.
Build an RSI testing routine
Choose one asset, timeframe and setup. Save twenty to thirty examples with price structure, RSI reading, entry logic, expiry and outcome. Review whether the rule improved selectivity and whether skipped trades were better than forced signals.
Quick checklist
- Identify trend or range before reading the RSI number.
- Treat 30 and 70 as zones, not instant entry buttons.
- Compare RSI swings with price swings and visible levels.
- Wait for price confirmation before acting on divergence.
- Avoid changing settings after every losing trade.
- Test timing and expiry on demo with a fixed risk rule.
Quick answers
What is the best RSI setting for Quotex?
The standard 14-period setting is a sensible place to learn. Faster settings add noise and slower settings add delay, so test any change on demo.
Is RSI above 70 a sell signal?
No. It shows strong upward momentum and can remain above 70 in an uptrend. Look for price confirmation and a useful location.
Is RSI below 30 a buy signal?
No. It shows strong downward momentum. Price can continue falling, so support and confirmation still matter.
What is RSI divergence?
Divergence occurs when price and RSI form different swing directions. It warns that momentum may be changing but does not guarantee reversal.
Can RSI work without other indicators?
Yes. Many traders combine it with price structure and support or resistance rather than stacking more momentum indicators.
Which timeframe works best with RSI?
No timeframe is always best. Pick one that fits the asset, session and expiry, then test the same rules consistently.
Does RSI guarantee winning trades?
No. RSI is a momentum tool, not a profit guarantee. Every setup needs risk control.
How should a beginner practise RSI?
Use the standard setting on demo, mark trend and levels first, and review twenty or more examples of one clearly written rule.