best indicators for Quotex
Best Indicators for Quotex Settings Combinations and Real Examples
Compare the best Quotex indicators, settings and combinations for trends, ranges and breakouts, with real EMA, RSI, Bollinger Bands, MACD, ADX and Stochastic examples.

Key points
- Choose the market condition before choosing an indicator: trend, range, breakout or disorder.
- Give each tool one job and avoid stacking indicators that repeat the same evidence.
- Treat settings such as EMA 50, RSI 14 and MACD 12, 26, 9 as demo-tested starting points, not universal formulas.
- Match expiry to completed chart candles and reject late, contradictory or news-driven setups.
Best Indicators for Quotex Settings Combinations and Real Examples
Searches for the “best indicator” usually begin with the wrong assumption: that one tool can predict the next candle. Indicators do not predict with certainty. They reorganize existing price data so that trend, momentum or volatility becomes easier to read. Their value depends on the market condition, the level where the signal appears and whether price confirms the idea before expiry.
For most beginners, the best Quotex setup is not the one with the most lines. It is a small stack in which every tool has a different job. One indicator can define direction, one can measure momentum, and price action can decide whether the entry is valid. When three indicators all calculate similar momentum, they do not provide three independent confirmations; they repeat the same information with different shapes.
Risk warning: Digital options can result in the complete loss of the amount placed on a trade. Indicator signals can fail in every market condition. Use demo first, keep position size fixed and never increase the amount to recover a loss.
Quick Comparison of the Best Quotex Indicators
| Indicator | Best job | Starting setting | Works best when | Main weakness |
|---|---|---|---|---|
| EMA | Trend direction and pullback rhythm | 20 or 50 | Price trends cleanly | Whipsaws in ranges |
| RSI | Momentum, exhaustion and divergence | 14; levels 30/70 | Used near a level | Can stay extreme |
| Bollinger Bands | Volatility and price extension | 20; deviation 2 | Range edges or compression | Band touch is not a reversal |
| MACD | Momentum shift and trend confirmation | 12, 26, 9 | After structure changes | Signals can lag |
| ADX | Trend-strength filter | 14; reference 20–25 | Separating trend from range | No direction by itself |
| Stochastic | Fast range momentum | 14, 3, 3 | Orderly sideways markets | Too sensitive in trends |
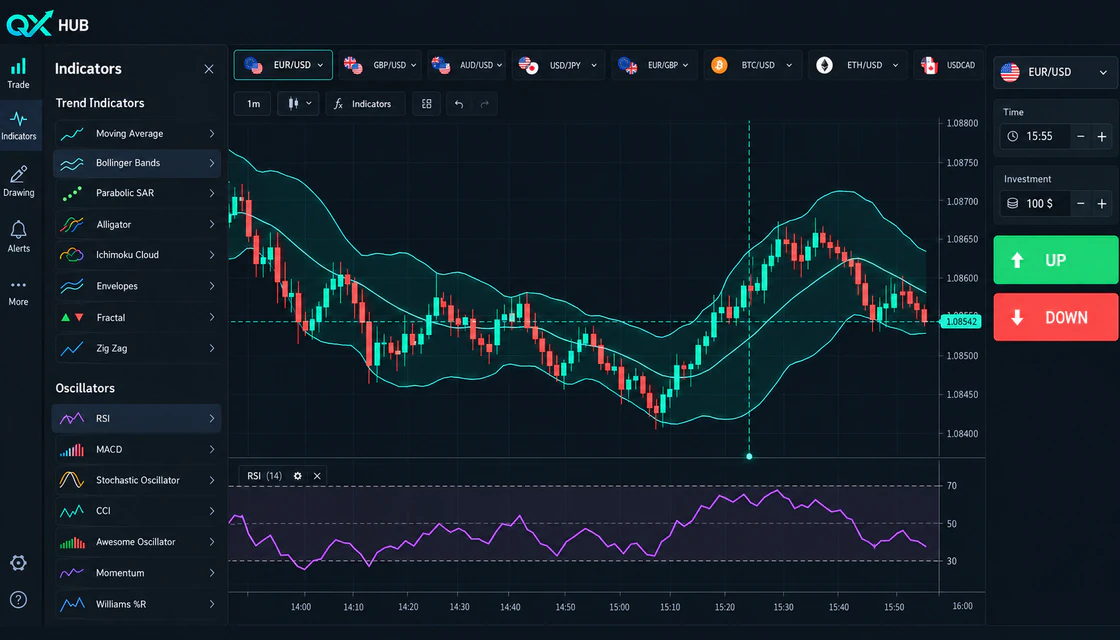
Choose the Market Before the Indicator
Indicators are condition-specific. A rising EMA is useful when swings progress in one direction, but it becomes a magnet for false entries when candles cross it repeatedly. Bollinger Bands can frame a stable range, but a strong breakout may ride one band for several candles. ADX can tell you that trend strength is increasing, but it cannot tell you whether the direction is up or down.
| Market condition | Visual clues | Useful tools | Default decision |
|---|---|---|---|
| Clean trend | Higher highs and higher lows, or the reverse | EMA + RSI; MACD + ADX | Trade with direction after a pullback or retest |
| Orderly range | Repeated reactions at horizontal edges | Bollinger Bands + RSI or Stochastic | Consider only confirmed edge reactions |
| Compression | Narrow bands and smaller candles | Bollinger width + structure | Wait for close and retest |
| High volatility | Large candles, widening spreads or news impulse | ADX as context; price first | Reduce risk or skip |
| Chaotic overlap | Alternating candles, no stable swings | None | No trade |
1 EMA for Trend Direction
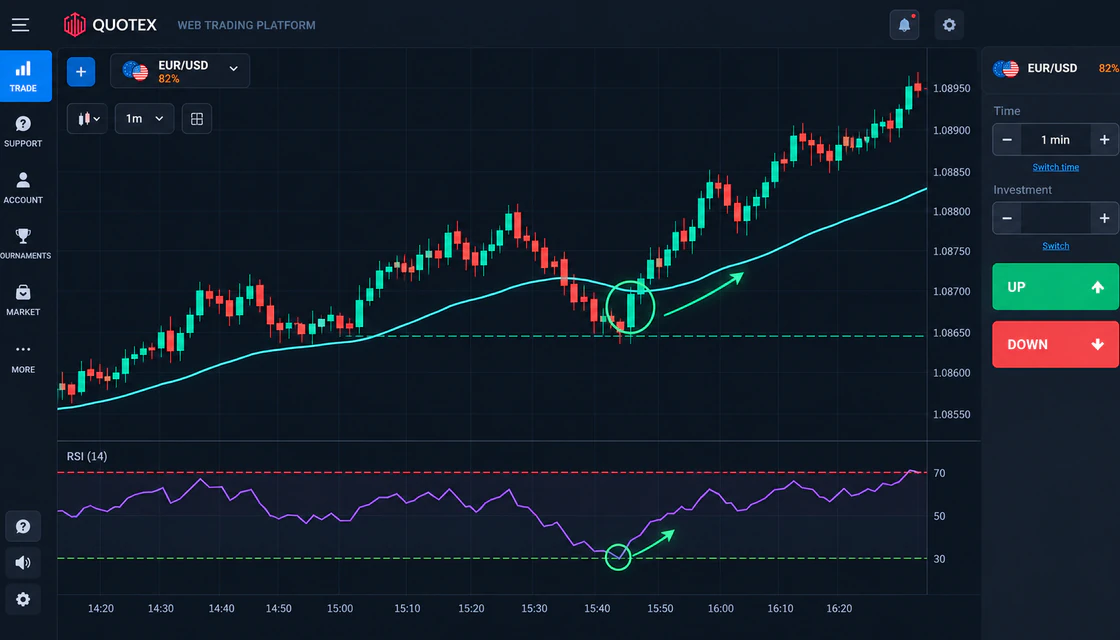
An exponential moving average gives more weight to recent prices than a simple moving average. On Quotex, it is most useful as a directional filter, not as a button. When price remains above a rising EMA and pullbacks respect nearby support, UP ideas have better context. When price stays below a falling EMA, DOWN ideas deserve more attention.
- EMA 20 reacts quickly and suits short momentum studies, but it produces more false crosses.
- EMA 50 is slower and often gives beginners a cleaner view of the short-term trend.
- EMA 200 is a broad context tool. On very short charts it may be too slow for entry timing.
Do not use: price crossing an EMA by itself. Require an established slope, a meaningful pullback area and a completed confirmation candle.
- The 5-minute chart prints higher highs and higher lows while EMA 50 slopes upward.
- Price pulls back toward EMA 50 and a prior support zone instead of falling in the middle of empty space.
- RSI 14 cools toward the 40–50 region. It is not required to reach 30 in a healthy uptrend.
- A bullish engulfing candle closes above the EMA and support area. The close is the trigger, not the unfinished candle.
- For demo testing, compare an expiry of three to five chart candles, or roughly 15–25 minutes on a 5-minute chart.
Skip the setup when: EMA is flat, price has crossed it repeatedly, the confirmation candle is unusually large, or a major news release is imminent.
2 RSI for Momentum and Divergence
RSI measures the speed and magnitude of recent price changes on a scale from 0 to 100. The standard period is 14. Readings above 70 are commonly called overbought and readings below 30 oversold, but these zones describe momentum pressure, not guaranteed reversal points.
In a strong uptrend, RSI may remain above 70 while price continues higher. In a strong downtrend, it may stay below 30. A better use is to compare RSI with market structure. At support, a move from below 30 back upward can support a bullish idea. During an uptrend pullback, RSI holding around 40–50 may show that momentum cooled without fully breaking. Divergence can warn that a trend is weakening, but price still needs to confirm the turn.
| RSI observation | What it may mean | Required confirmation |
|---|---|---|
| Below 30 | Selling is stretched | Support plus bullish candle close |
| Above 70 | Buying is stretched | Resistance plus bearish candle close |
| Bullish divergence | Downward momentum is weakening | Break of a recent lower high |
| Bearish divergence | Upward momentum is weakening | Break of a recent higher low |
| 40–50 hold in uptrend | Pullback may remain healthy | Reaction at EMA or support |
3 Bollinger Bands for Volatility and Range Edges
Bollinger Bands usually combine a 20-period moving average with upper and lower bands placed two standard deviations away. The bands expand when volatility rises and contract when price becomes quiet. Their strongest contribution is context: they show whether price is close to its recent average, stretched from it or compressing before a possible expansion.
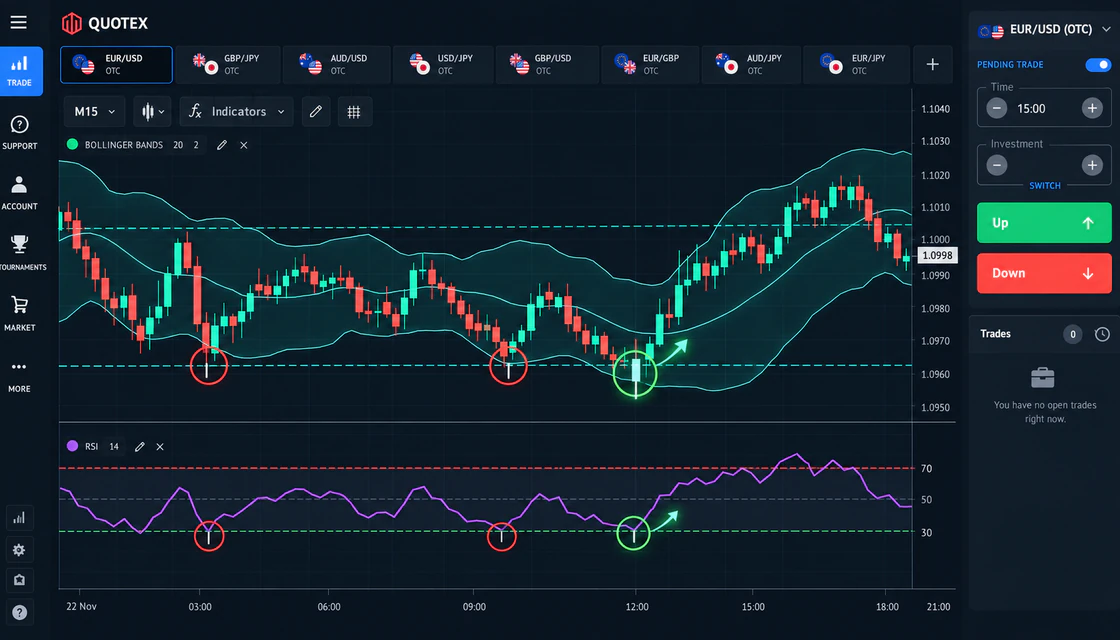
A touch of the upper band is not automatically a DOWN signal, and a touch of the lower band is not automatically an UP signal. During a strong trend, candles can travel along a band. Range-reversal ideas become more credible when a band touch happens at visible horizontal support or resistance and a confirming candle closes back inside the bands.
- The chart is a range, not a strong downtrend. Support and resistance have already produced several reactions.
- Price reaches the lower Bollinger Band and horizontal support at the same time.
- RSI 14 moves below 30 and then turns back upward. The turn matters more than the first extreme reading.
- A bullish pin bar or engulfing candle closes back inside the band and above support.
- The opposite side of the range is context, not a guaranteed target. For digital options, test an expiry of three to four chart candles and record whether the reaction develops quickly enough.
Invalid examples: a lower-band touch in a powerful downtrend, a signal in the middle of the range, or an entry before the candle closes.
4 MACD for Momentum Shifts
MACD compares two exponential averages and plots their relationship through a MACD line, a signal line and a histogram. The common setting is 12, 26, 9. A bullish crossover can show momentum improving; a bearish crossover can show deterioration. Histogram expansion can help confirm that an impulse is gaining strength.
MACD is a lagging indicator. That is not automatically a flaw: waiting for confirmation can be useful. The mistake is entering solely because two lines crossed after price has already made a large move. MACD works better after a breakout, structure shift or retest that gives the crossover a clear price-based reason.
5 ADX for Trend Strength
Average Directional Index measures trend strength rather than direction. A rising ADX often means a directional move is becoming stronger. Readings around 20–25 are commonly used as a reference zone, but the slope and recent context matter more than one exact number. A high ADX does not mean “UP”; it means the active direction has strength.
ADX is especially useful as a filter. If an EMA strategy is producing repeated crosses while ADX remains weak and flat, the market may be too sideways. If price breaks structure and ADX rises, trend-continuation ideas deserve more attention. Always determine direction from price or a directional tool first.
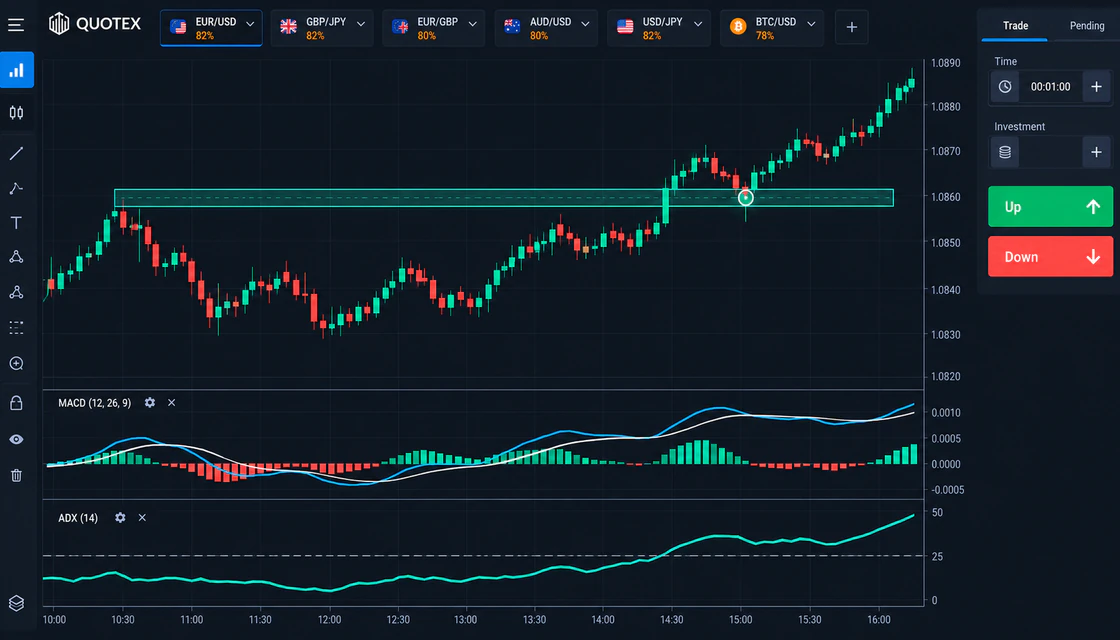
- Price closes above a resistance zone with a clear body rather than only a wick.
- MACD crosses bullish and the histogram begins expanding above the center line.
- ADX rises from a weak region, showing that trend strength is improving.
- Price retests the broken resistance and closes back above it. This is safer than chasing the breakout candle.
- Expiry should allow the retest reaction to develop. Test three to five candles on demo and compare it with entering immediately at the breakout.
6 Stochastic for Orderly Ranges
The Stochastic oscillator compares the current close with the recent trading range. A common setting is 14, 3, 3, with 80 and 20 as reference zones. It reacts faster than RSI and can be useful near well-defined range boundaries. That speed is also its weakness: in a trend it can flash repeated reversal signals while price keeps moving.
Best use: range edge plus horizontal level plus closed reversal candle. Avoid using Stochastic and RSI together as if they were independent confirmations because both measure momentum.
The Best Indicator Combinations for Quotex
| Combination | Market | Rules in one line | Avoid when |
|---|---|---|---|
| EMA 50 + RSI 14 | Clean trend | Trade pullback with trend after RSI cools and candle confirms | EMA is flat or price is extended |
| Bollinger 20,2 + RSI 14 | Orderly range | Band and range edge align; RSI turns; candle closes inside | Bands expand in a strong trend |
| MACD 12,26,9 + ADX 14 | Breakout / continuation | Structure breaks; MACD expands; ADX rises; retest holds | Breakout is already overextended |
| EMA 20 + Bollinger 20,2 | Compression study | Watch squeeze, then wait for close and retest | Using band touch as reversal |
| Support / resistance + one oscillator | Beginner universal | Level first; oscillator context; candle trigger | No clear level exists |
| Layer | Good evidence | Duplicate or weak evidence |
|---|---|---|
| Direction | Swing structure or EMA slope | Three moving averages crossing together |
| Location | Support, resistance or retest | Indicator signal in the middle of noise |
| Momentum | One RSI or MACD reading | Several oscillators saying the same thing |
| Timing | Completed candle or structure break | Unfinished candle shape |
| Risk | Fixed stake and session stop | Increasing size after a loss |
A clean setup has independent layers. For example, EMA defines direction, RSI shows momentum has reset, support provides location and an engulfing candle supplies timing. An overloaded chart may contain RSI, Stochastic, Williams %R and CCI. All four are momentum oscillators, so their agreement may be less independent than it appears.
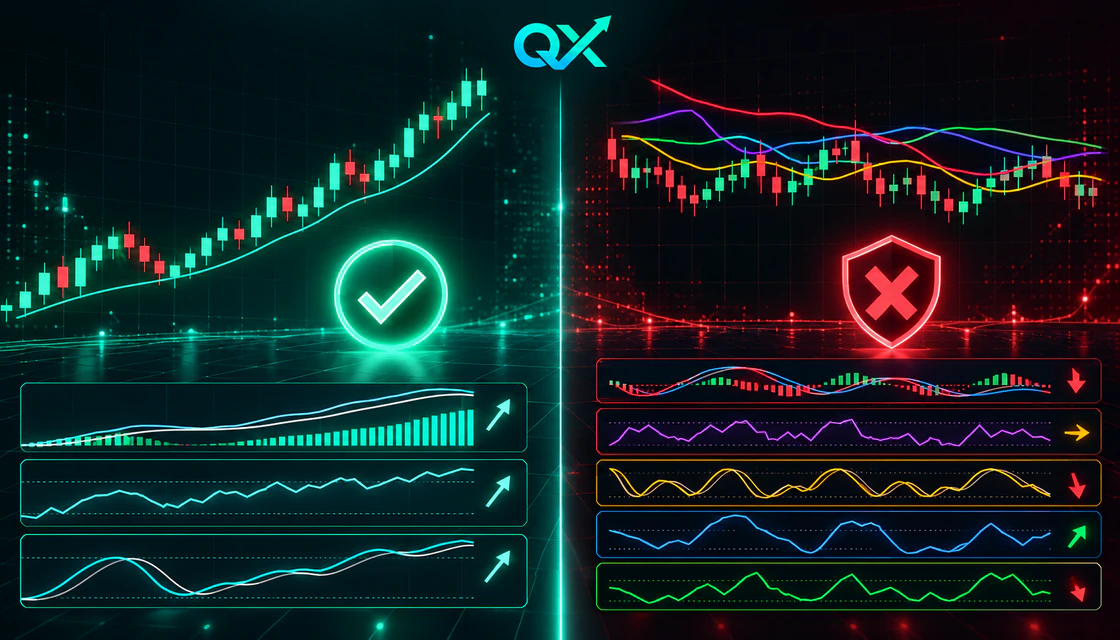
Expiry Logic for Indicator Setups
Indicators are calculated from completed and developing candles, while a digital-option result is decided at expiry. A good chart idea can still lose if the expiry is much shorter than the movement being analyzed. Match the expiry to the candle rhythm rather than choosing it after the signal appears.
These are testing ranges, not promises. Compare the same rule across a documented sample before changing it. Do not shorten expiry because the entry was late; if the move has already happened, skip it.
| Chart timeframe | Demo starting range | Why |
|---|---|---|
| 1 minute | 3–5 minutes | Allows several candles but remains highly noisy |
| 5 minutes | 15–25 minutes | Fits three to five candles and most examples in this guide |
| 15 minutes | 45–75 minutes | Allows slower confirmation and retest behavior |
When Indicators Should Lead to No Trade
- EMA is flat and candles cross it repeatedly.
- RSI is extreme but price is not near a meaningful support or resistance zone.
- Bollinger Bands are expanding strongly against the reversal idea.
- MACD confirms only after a very large candle has already completed the move.
- ADX shows strength but the price direction is unclear.
- Indicators disagree because the market is transitioning from range to trend.
- A scheduled economic release can create abnormal volatility.
- The setup requires an expiry shorter than the chart rhythm to look attractive.
- The daily stop has been reached or the next trade is motivated by recovery.
Risk Rules for Indicator Trading
- Choose the stake before opening the chart. A conservative demo benchmark is 0.5%–1% of the account per attempt.
- Use the same amount after wins and losses. Do not use Martingale or recovery sizing.
- Set a daily limit, such as two or three full-risk losses, and stop when it is reached.
- Do not take several positions on highly correlated assets at the same time.
- Score process separately from outcome. A correct setup can lose; a random setup can win.
- Check the current asset payout before every trade. A high-quality chart does not repair poor payout math.
Thirty Case Demo Test
- Choose one asset, one session window and one chart timeframe.
- Choose one stack: EMA 50 plus RSI 14, or Bollinger Bands 20,2 plus RSI 14.
- Write the entry rule and skip rule before the first example.
- Capture the chart before entry and after expiry. Include valid setups you skipped.
- Record market condition, level, indicator signal, candle confirmation, expiry, result and process score.
- Complete thirty cases without changing settings. Then compare trend, range and chaotic results.
- Change only one variable for the next sample, such as expiry or EMA period.
| Journal field | Example |
|---|---|
| Asset and session | EUR/USD, London session |
| Chart and expiry | 5-minute chart, 20-minute expiry |
| Market condition | Uptrend with orderly pullback |
| Location | EMA 50 plus prior support |
| Momentum | RSI recovered from 44 |
| Trigger | Bullish engulfing candle closed |
| Risk | Fixed 0.5% demo stake |
| Process score | 7/7 rules followed |
| Review note | Good setup; entry not chased |

Pre Trade Checklist
| Question | Check |
|---|---|
| Can I describe the market as trend, range, compression or chaos? | □ |
| Is price at a meaningful level rather than in the middle? | □ |
| Does each indicator have a different job? | □ |
| Has the confirmation candle closed? | □ |
| Does expiry allow several chart candles? | □ |
| Is a major news event close? | □ |
| Is the stake fixed and within the daily plan? | □ |
| Would I take the same setup after a previous loss? | □ |
Common Beginner Mistakes
| Mistake | Why it fails | Better rule |
|---|---|---|
| Buying because RSI is below 30 | Strong trends stay oversold | Require support and a closed reversal candle |
| Selling every upper-band touch | Price can ride the band | Classify range versus trend first |
| Trading every EMA crossover | Sideways markets create whipsaws | Check slope and swing structure |
| Using MACD after a huge candle | Signal arrives too late | Wait for retest or skip |
| Treating ADX as direction | ADX measures strength only | Read direction from price |
| Stacking four oscillators | Signals duplicate momentum | One tool per job |
| Changing settings after losses | Destroys the sample | Finish thirty cases first |
| Shortening expiry to catch up | Noise decides the outcome | Match expiry to timeframe |
Conclusion
The best indicators for Quotex are the ones that solve a specific chart problem. EMA helps define direction. RSI and Stochastic describe momentum. Bollinger Bands frame volatility and price extension. MACD confirms momentum shifts. ADX filters trend strength. None of them creates an edge without market structure, location, a completed candle, sensible expiry and controlled risk.
For a beginner, start with EMA 50 and RSI 14 on a 5-minute chart. Test only clean trend pullbacks near support or resistance. If the market is clearly ranging, test Bollinger Bands 20,2 with RSI 14 at the edges. Complete thirty documented demo cases before changing settings or considering real funds.
Quick answers
What is the best indicator for Quotex?
There is no universal best indicator. EMA 50 is a practical trend filter, RSI 14 is useful for momentum, Bollinger Bands help with volatility and ranges, and MACD plus ADX can support breakout confirmation.
Which indicator combination is best for beginners?
EMA 50 plus RSI 14 is simple because the tools have different jobs: EMA defines direction and RSI shows whether momentum has cooled or become stretched.
What are the best Quotex indicator settings?
Useful starting settings are EMA 20 or 50, RSI 14 with 30/70 levels, Bollinger Bands 20 and 2, MACD 12/26/9, ADX 14 and Stochastic 14/3/3. They must be tested, not treated as guarantees.
Is RSI enough to trade on Quotex?
No. RSI can remain extreme during a strong trend. Combine it with support or resistance, trend context and a completed confirmation candle.
Is MACD good for one minute trading?
It can be used, but lower timeframes contain more noise and MACD can lag. Beginners usually get cleaner practice from a 5-minute or 15-minute chart.
Can Bollinger Bands predict reversals?
No. A band touch shows price extension, not certainty. Reversal quality improves when the touch aligns with a range edge and price closes back inside the bands.
How many indicators should I use?
Usually one trend tool and one momentum or volatility tool are enough. Add price structure and risk rules rather than another oscillator.
What does ADX tell a Quotex trader?
ADX estimates trend strength. It does not show direction, so use price structure, EMA or directional components to determine whether the move is up or down.
Should I use indicators on OTC assets?
You can test them, but OTC conditions and pricing can differ from standard market sessions. Use smaller risk, separate journal statistics and avoid assuming settings transfer perfectly.
Can indicator strategies guarantee profit?
No. Every indicator and combination can fail. The practical goal is a consistent process, controlled downside and enough demo data to evaluate the rules.
Next step
Choose a topic by task: brokers for platform selection, guides for access, strategies for setups, risk for discipline and investing for longer market logic.