trend lines on Quotex
Trend Lines on Quotex: Pullbacks, Breakouts and False Signals
Learn how to draw trend lines on Quotex, validate touches, trade pullbacks, confirm breakouts and avoid false signals with a practical demo plan.
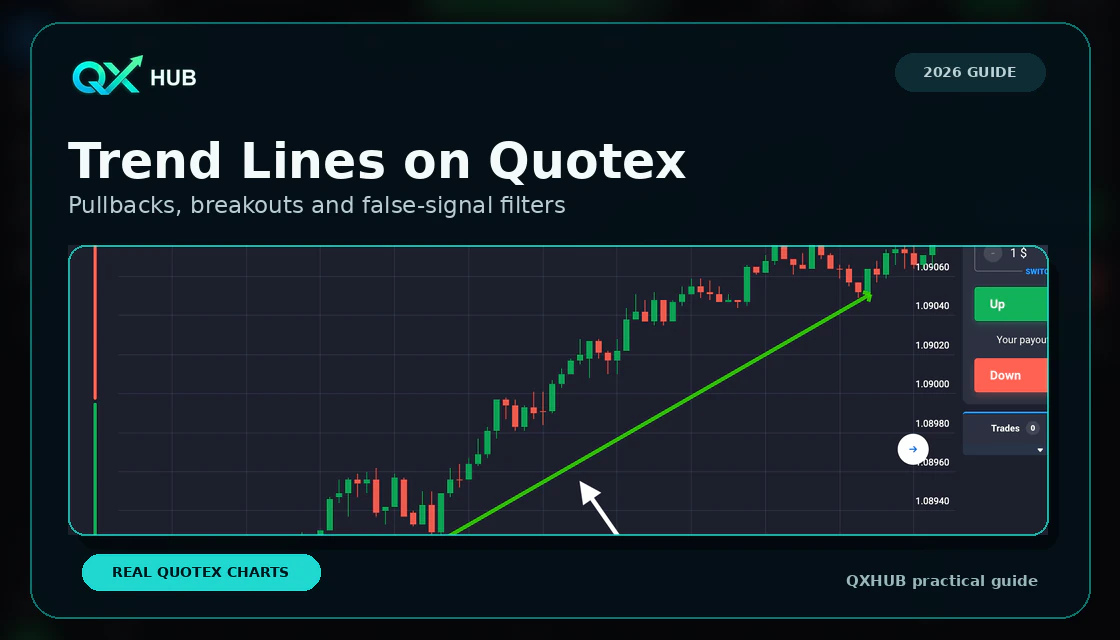
Key points
- Connect meaningful swing lows in an uptrend and swing highs in a downtrend instead of forcing a line through random candle tips.
- Treat a trend line as a narrow reaction zone and location filter, not as an automatic entry signal.
- Use two anchors to draw the line and a third clean reaction or structure confirmation to test whether the market respects it.
- For breakouts, wait for a candle close and preferably a controlled retest rather than chasing the first cross or wick.
Quick answer
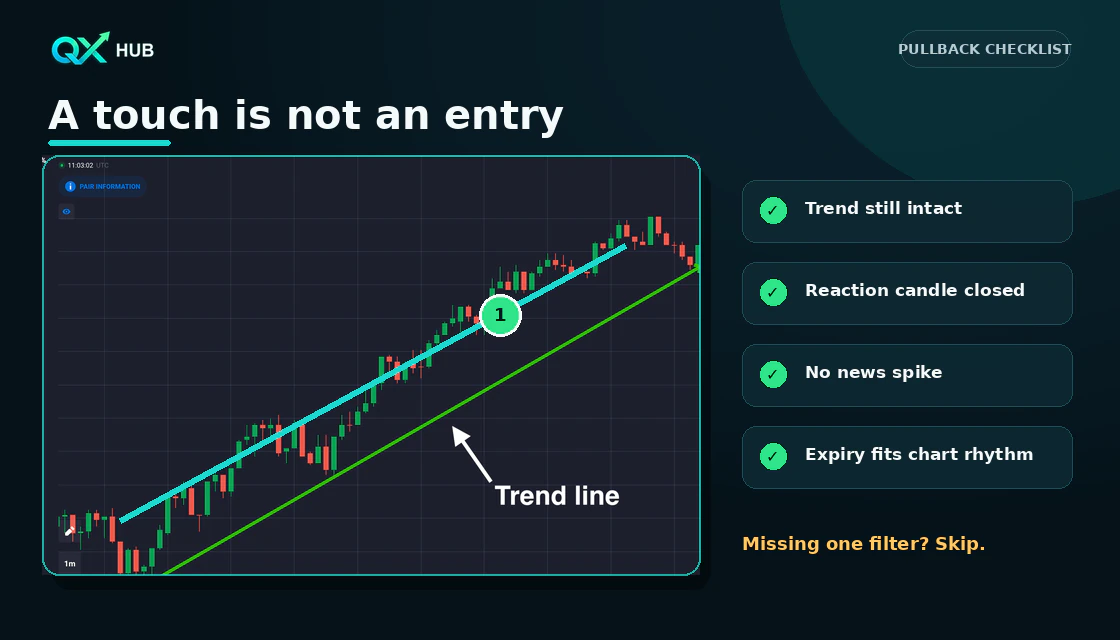
A useful trend line connects meaningful swing points, follows visible market structure and stays consistent when the chart is zoomed normally. In an uptrend, draw beneath rising swing lows. In a downtrend, draw above falling swing highs. Two points create the line; a clean third reaction gives it more practical value. Do not enter because price merely touches the line. Wait for a completed reaction candle, check the nearest horizontal level, match expiry to the chart rhythm and keep the amount fixed before the setup appears.
- Use swing points, not random candle tips.
- Treat the line as a narrow reaction zone rather than an exact price.
- A breakout needs a close and preferably a retest.
- Redraw only when market structure changes, not to make a losing idea look correct.
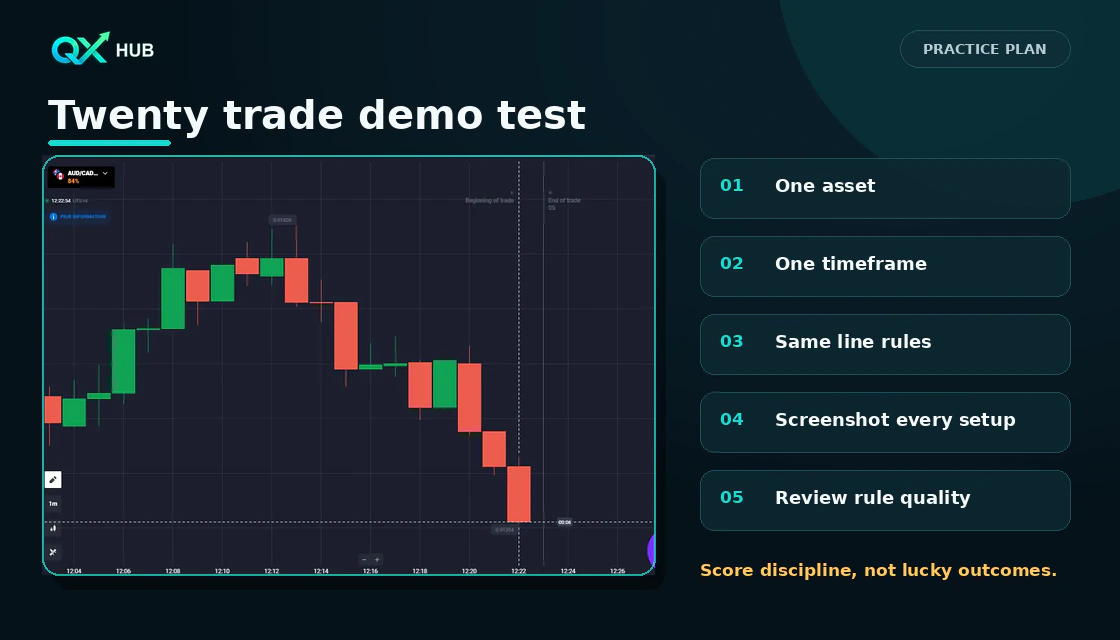
- Practise twenty documented setups on demo before judging the method.
What a trend line actually tells you
A trend line is a visual summary of direction and rhythm. It can show whether buyers keep defending higher prices or sellers keep rejecting lower rallies. It cannot tell you with certainty that the next touch will hold. Its value is organizational: it gives the trader a location to watch, a condition that invalidates the idea and a reason to avoid entries in the middle of noise.
Trend lines and horizontal support or resistance answer different questions. A horizontal level asks where price reacted. A trend line asks how that reaction is moving through time. The cleanest setups often appear where both agree, but extra confluence should not become an excuse to ignore risk.
How to select the Trend Line tool
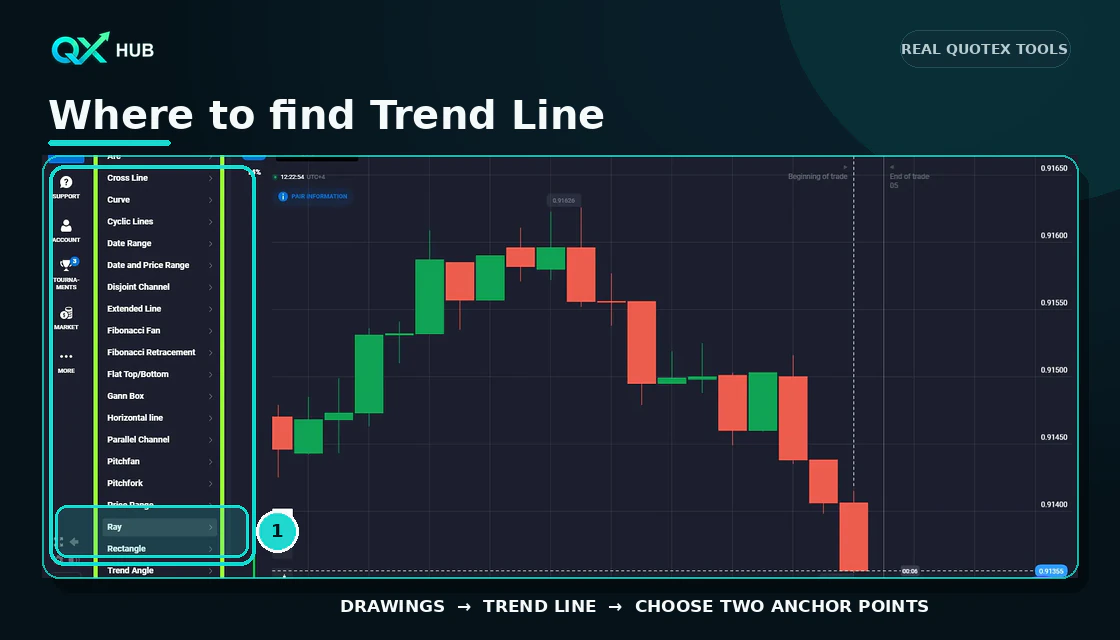
Open the chart drawing menu, select Trend Line and place the first anchor on a clear swing point. Place the second anchor on the next meaningful swing in the same direction. Extend the line forward only after those anchors are correct. The real Quotex interface can change, so use the current tool names and controls shown in your account.
How to draw an uptrend line
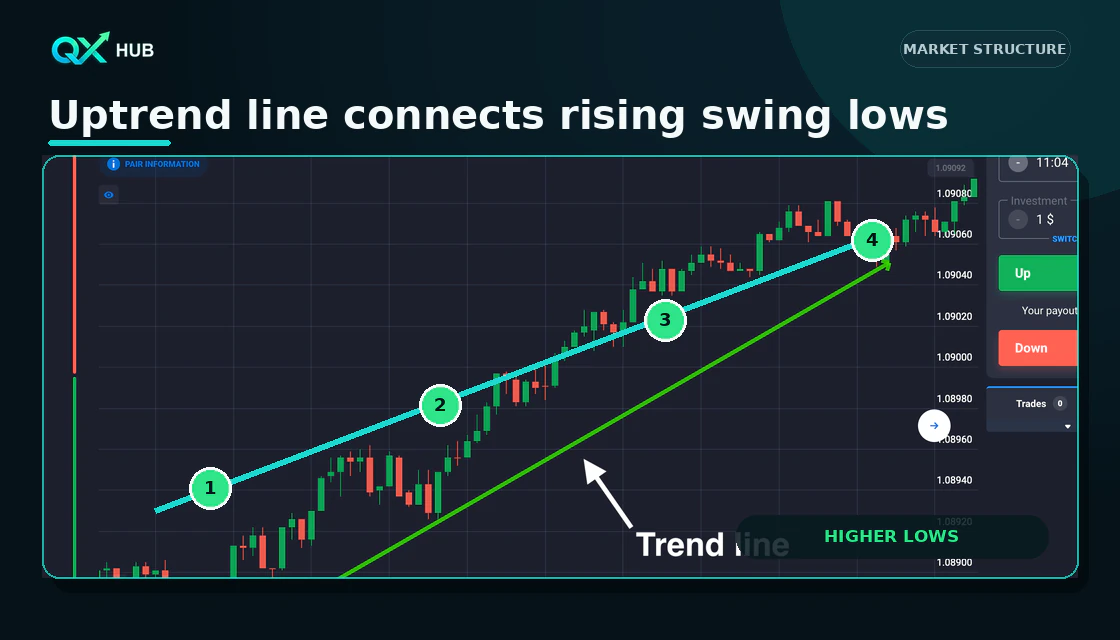
Start with a visible swing low, then connect it to a later higher low. The line belongs under price because it tracks where buyers have repeatedly stepped in. Ignore a tiny isolated wick if using it makes the rest of the structure meaningless. Consistency matters more than forcing every candle to touch.
Uptrend line checklist
- The second anchor is a clear higher low.
- Most candle bodies remain above the line.
- The slope is readable rather than nearly vertical.
- A third reaction occurs near the same path.
- The nearest resistance leaves room for the setup to develop.
How to draw a downtrend line
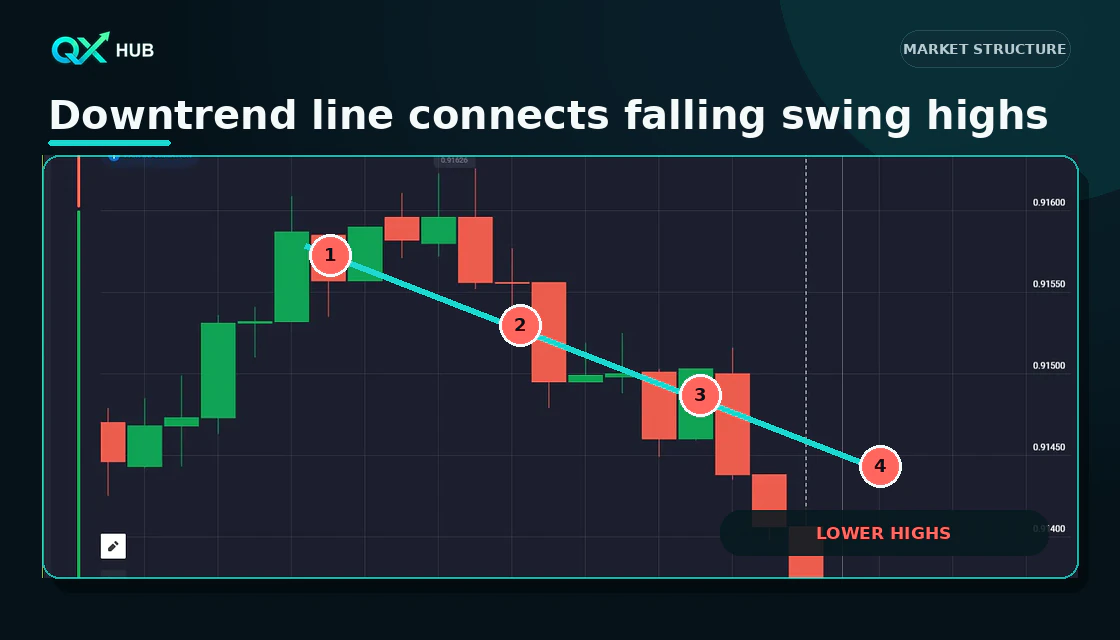
A downtrend line is drawn above price through falling swing highs. It tracks the points where rallies lose strength. The first two anchors define the line; later rejections test whether sellers still control the rhythm. A line that cuts through most candle bodies is probably not describing the current structure.
| Question | Uptrend | Downtrend |
|---|---|---|
| Anchor points | Swing lows | Swing highs |
| Structure | Higher lows | Lower highs |
| Line position | Below price | Above price |
| Healthy reaction | Bullish rejection | Bearish rejection |
| Invalidation clue | Close and hold below | Close and hold above |
The two point rule and the third touch
Two anchors are mathematically enough to draw any line, but they are not enough to prove that the market respects it. The third touch is useful because it tests the line without changing its original placement. Even then, it is evidence rather than certainty. A reaction can fail, especially near news, session transitions or a major horizontal level.
Do not redraw after every small wick. A professional line should survive normal chart movement. Redraw when a new swing clearly breaks the previous structure and a different pair of anchors better explains the market, not when the original trade is uncomfortable.
Trend line pullback setup
The pullback setup waits for price to return to an established line while the broader structure remains intact. The line provides location, not the entry. A cleaner bullish example requires an uptrend, a controlled return toward the line, a completed bullish reaction candle and no immediate resistance overhead. The bearish version reverses the logic.
| Gate | What must be true | Skip when |
|---|---|---|
| Structure | Higher lows or lower highs remain intact | Recent swing is broken |
| Location | Price returns near a validated line | Entry is far from the line |
| Reaction | A confirmation candle closes | Only an unfinished wick appears |
| Timing | Chart speed and expiry match the test | News or sudden acceleration |
| Risk | Fixed amount and session stop are set | Stake changes after a loss |
Five gate entry model
Trend line breakout and retest
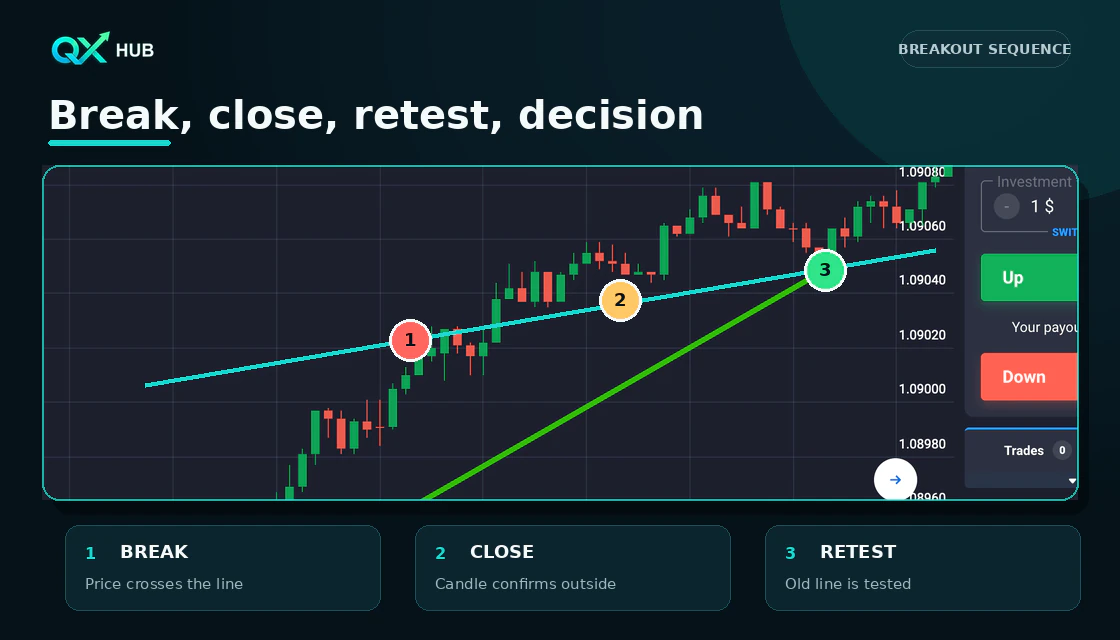
A breakout begins when price crosses the line, but the cross alone is weak evidence. Wait for a candle to close beyond it. Then watch whether price retests the old line from the other side. A held retest can show that the previous trend rhythm has changed. If price immediately returns inside the old structure, the break may be false.
Do not assume every trend-line break creates a reversal. Sometimes the slope was simply too steep and the market moves sideways before continuing. Check horizontal structure: a bullish break above a downtrend line is stronger when price also clears a real swing high. A bearish break below an uptrend line is stronger when a swing low fails.
How to filter false breakouts
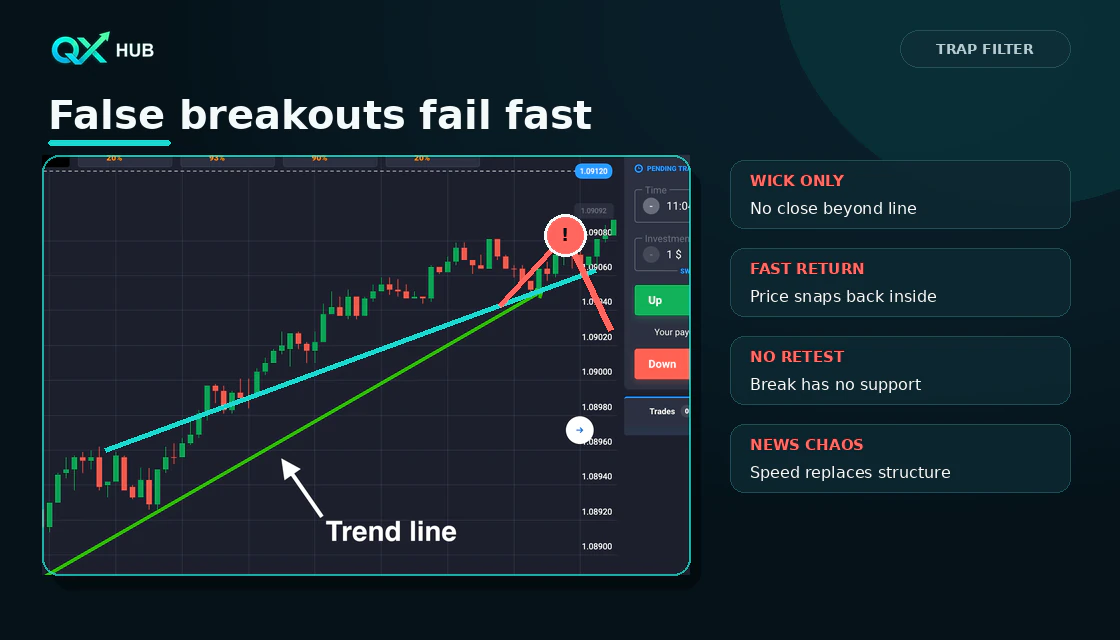
False breakouts are common because obvious lines attract early entries. The clearest warning is a wick beyond the line followed by a close back inside. Other warnings include a break with no follow-through, an immediate return, an unchanged horizontal structure or a move driven by a high-impact release.
- Wait for the candle to close; an open candle can change shape quickly.
- Check whether a swing high or low also broke.
- Prefer a controlled retest to a late chase.
- Skip if the first breakout candle is abnormally large.
- Reduce frequency after two failed attempts; the chart may be changing regime.
Timeframe and expiry logic
Use one timeframe to define the trend and one timeframe, at most, to refine the reaction. Constant switching creates hindsight. A practical demo starting point is M15 or M5 for structure, then an expiry sample equivalent to several completed chart candles. This is a testing framework, not a promise. Very short expiries can turn a correct market idea into a timing loss.
| Chart job | Starter choice | What to record |
|---|---|---|
| Context | M15 or M30 | Trend, range, nearest horizontal level |
| Setup | M5 or M15 | Anchors, third touch, reaction candle |
| Expiry test | 3 to 5 chart candles | Exact duration and outcome |
| Review | After expiry | Rule quality, screenshot, emotion |
Common trend line mistakes
Forcing the line through price
If the line cuts through most candles, it is not describing a boundary. Choose clearer anchors or admit that the market is ranging.
Using one wick as the entire trend
An extreme spike can distort the slope. Check whether the line still explains the majority of reactions at normal zoom.
Entering on the first touch
A touch is only location. Wait for the reaction rule defined before the session.
Ignoring horizontal levels
A beautiful uptrend line directly under major resistance may have little room. Read both diagonal and horizontal structure.
Redrawing after a loss
Moving the line to justify the old trade destroys the test. Preserve the original screenshot and classify the mistake honestly.
Twenty trade demo practice plan
Test the method as a routine rather than a hunt for perfect screenshots. Use one asset, one setup and fixed settings for twenty trades. Record skipped setups too; restraint is part of the result.
| Journal field | Record |
|---|---|
| Market | Asset, date, session and payout |
| Structure | Uptrend, downtrend or range |
| Anchors | Why each swing point matters |
| Setup | Pullback or breakout retest |
| Confirmation | Candle type and close |
| Execution | Amount, timeframe and expiry |
| Review | Rule followed, result and one improvement |
Pre trade checklist
- Trend or range is identified before drawing.
- Two meaningful anchors define the line.
- A third reaction or structure confirmation exists.
- The entry is near the line, not late after the move.
- The candle has closed.
- Horizontal support or resistance is checked.
- No high-impact news is about to distort the chart.
- Amount and session stop were set before the setup.
- Demo or live account mode is confirmed.
- The reason to skip is as clear as the reason to enter.
Quick answers
How many points are needed for a trend line?
Two points create a line, but a third clean reaction gives it more practical validation.
Should I draw through candle bodies or wicks?
Use the anchor method that best describes repeated reactions. Do not mix methods only to make a line fit.
Is a trend-line touch a trading signal?
No. It is a location. Wait for structure, candle confirmation, timing and risk rules.
What confirms a trend-line breakout?
A candle close outside, a broken swing and a held retest provide stronger evidence than a wick alone.
Which timeframe is best?
There is no universal best timeframe. M5 to M30 can be practical for demo testing because structure is easier to read than on ultra-short charts.
Can indicators confirm a trend line?
A moving average or RSI can add context, but price structure and the candle close should remain primary.
When should I redraw the line?
Redraw after market structure clearly changes, not after a losing trade simply to preserve the old idea.
Do trend lines guarantee results?
No. They organize analysis and define invalidation; any trade can still lose the full stake.
Next step
Choose a topic by task: brokers for platform selection, guides for access, strategies for setups, risk for discipline and investing for longer market logic.