RSI and Bollinger Bands strategy on Quotex
RSI and Bollinger Bands Strategy on Quotex: Settings, Entries and False-Signal Filters
Use RSI and Bollinger Bands on Quotex with exact settings, a five-gate entry model, bullish and bearish examples, expiry guidance, payout math and a 30-trade demo plan.

Key points
- Use Bollinger Bands 20,2 to identify extension and RSI 14 to measure momentum, not as automatic entry commands.
- Require market context, a pre-marked level, extension, a completed confirmation candle and suitable timing before entry.
- Skip early reversals during a strong band walk, when expanding bands and repeated outer-band closes show trend strength.
- Match demo expiry to three to five completed chart candles and record the actual payout for break-even analysis.
RSI and Bollinger Bands Strategy on Quotex
The RSI and Bollinger Bands strategy combines momentum with volatility. RSI shows whether recent buying or selling pressure has become stretched. Bollinger Bands show how far price is trading from its recent average and whether volatility is expanding or contracting. Together they can help filter reversal ideas, but only when market structure, candle confirmation and expiry also agree.
The central mistake is treating an extreme reading as a command. RSI below 30 does not mean price must rise next. A lower-band touch does not mean sellers are finished. Strong trends can remain extreme and travel along a band for many candles. The strategy becomes useful only when it answers five questions in order: market, location, extension, confirmation and timing.
Risk warning: A digital-option trade can lose the full amount placed. No indicator combination guarantees a result. Use demo mode first, keep the amount fixed, stop after a predefined loss limit and confirm whether the service is permitted where you live.
| Component | Bullish setup | Bearish setup |
|---|---|---|
| Market | Range or controlled pullback | Range or controlled rally |
| Location | Established support | Established resistance |
| Bollinger Bands | Price tests or pierces lower band | Price tests or pierces upper band |
| RSI 14 | Below 30, then turns upward | Above 70, then turns downward |
| Confirmation | Bullish candle closes inside band | Bearish candle closes inside band |
| Expiry test | Usually 3–5 chart candles | Usually 3–5 chart candles |
| Cancel when | Strong downtrend, news spike, late entry | Strong uptrend, news spike, late entry |
What RSI Measures
The Relative Strength Index is a momentum oscillator displayed from 0 to 100. The standard 14-period setting compares recent gains and losses. Readings above 70 are commonly labelled overbought and readings below 30 oversold. These labels describe momentum pressure, not a guaranteed turning point.
The most useful event is often the exit from an extreme. In a bullish setup, RSI first falls below 30 and then turns back above it as price confirms support. In a bearish setup, RSI rises above 70 and then moves lower while price rejects resistance. The turn shows that momentum has started to change; the candle close shows that price agrees.
Trend adjustment: In a healthy uptrend, RSI may find support near 40–50 instead of reaching 30. In a downtrend, rallies may fail near 50–60. Do not force the classic 30 and 70 rule into every market regime.
What Bollinger Bands Measure
Bollinger Bands normally use a 20-period moving average with upper and lower bands two standard deviations away. The middle band represents the recent average. The outer bands widen when volatility grows and contract when the market becomes quiet.
- A band touch shows price extension, not automatic reversal.
- A close outside the band can show strength, especially when the bands are expanding.
- A close back inside the band after an extreme is stronger reversal evidence than the first touch.
- The middle band can act as a practical first reaction area, but it is not a guaranteed target.
- A squeeze identifies compression; it does not predict breakout direction.
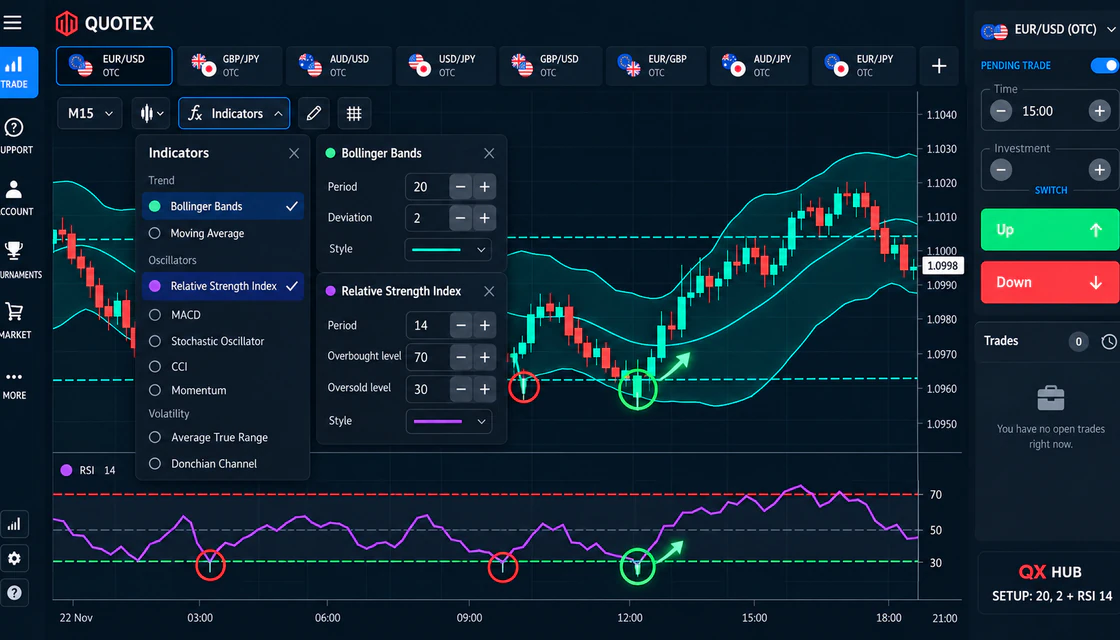
Exact Quotex Settings
Keep these settings unchanged during the first test. If you change the period, timeframe and expiry together, you cannot tell which change affected the result. Optimization comes after a documented baseline, not before it.
| Setting | Start with | Why |
|---|---|---|
| Chart type | Candles | Shows close, wick rejection and confirmation clearly |
| Timeframe | M5 or M15 | Cleaner structure than ultra-short charts |
| Bollinger period | 20 | Balanced view of the recent average |
| Deviation | 2 | Standard measure of normal price extension |
| RSI period | 14 | Balanced momentum sensitivity |
| RSI levels | 70 and 30 | Clear starting extremes for demo testing |
| Expiry sample | 3–5 candles | Gives the confirmed reaction time to develop |
The Five Gate Entry Model
- Market. Identify a range, a controlled pullback or a strong trend. Reversal setups are safest in ranges and at established levels, not against accelerating trends.
- Location. Mark support or resistance before the indicator becomes extreme. A level drawn after the signal is hindsight, not a rule.
- Extension. Price must test the relevant Bollinger Band while RSI reaches or approaches an extreme.
- Confirmation. Wait for a completed rejection, pin bar or engulfing candle that closes back inside the band. Never judge an unfinished candle.
- Timing. Enter only if the move has not already travelled too far and the planned expiry matches the chart rhythm.
Minimum rule: If one gate is missing, the setup is incomplete. Fewer complete setups are more useful than many approximate ones.
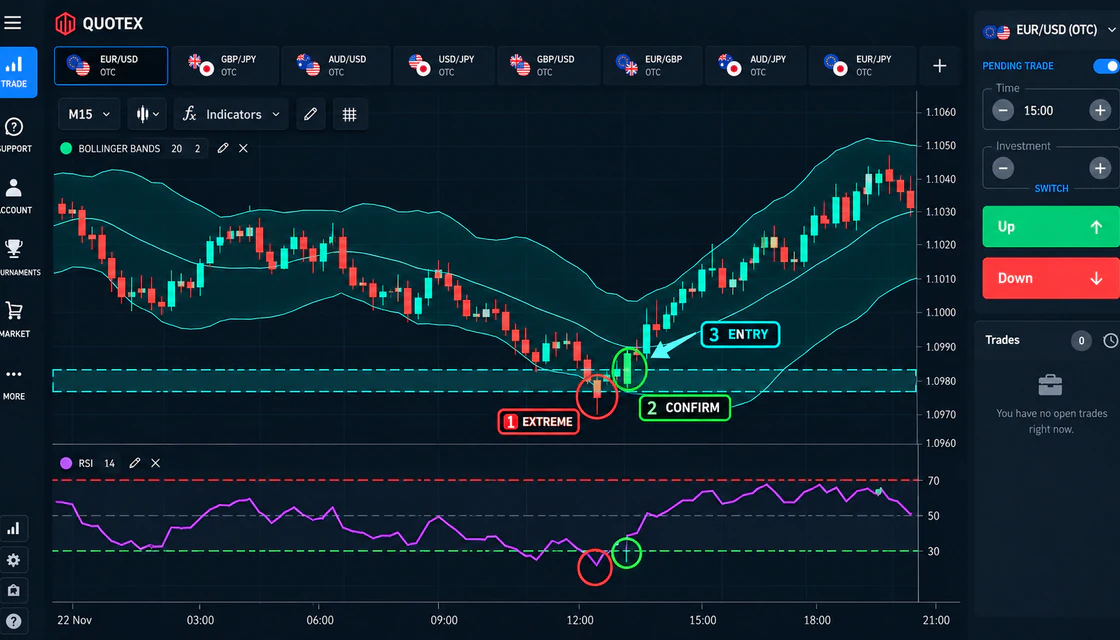
Bullish Setup Step by Step
- Confirm that price is ranging or making a controlled pullback rather than accelerating downward.
- Mark support from at least two earlier reactions. The level must exist before the signal.
- Wait for price to touch or pierce the lower band and for RSI 14 to fall below 30 or clearly turn from the oversold area.
- Require a bullish candle to close back inside the band and hold the support zone.
- Enter only after the candle closes. Test an expiry of three to five candles and record the exact choice before the trade.
- Cancel if the confirmation candle is unusually large, if a news release caused the move or if price closes decisively below support.
Assume EUR/USD is on a five-minute chart inside a visible range. Support near 1.0980 has already held twice. Price makes a third push through the lower band, RSI prints 27, and the next candle engulfs the prior bearish body and closes at 1.0986 inside the band. The entry is considered only after that close. A 15–25 minute demo expiry gives the reaction three to five candles. If the bullish candle instead closes below support, there is no trade.
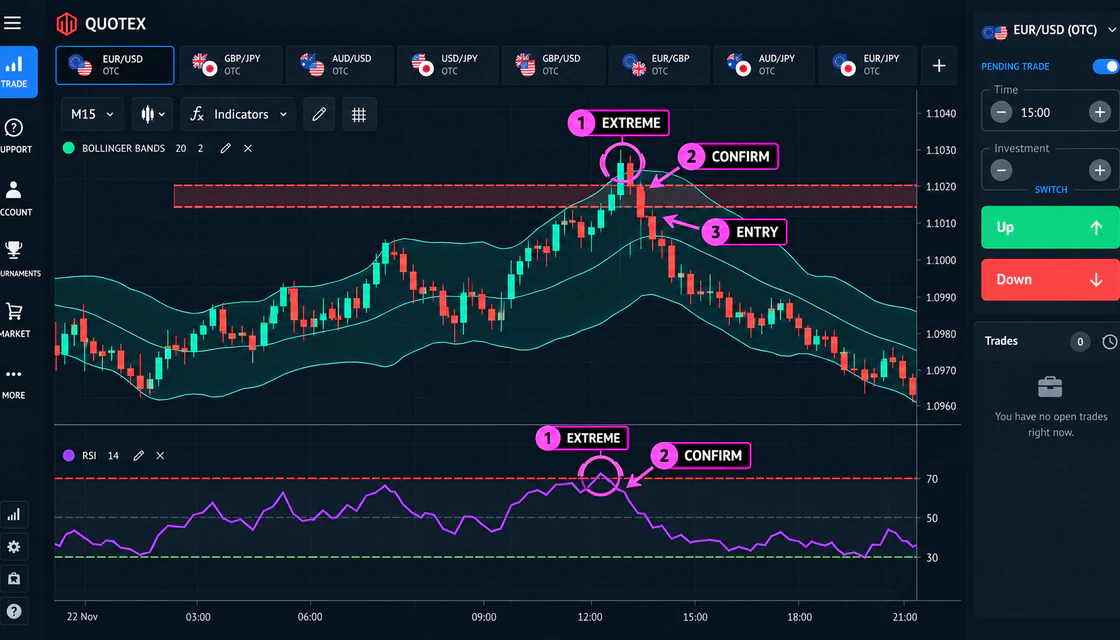
Bearish Setup Step by Step
- Confirm that price is ranging or completing a controlled rally rather than accelerating upward.
- Mark resistance from previous reactions before price reaches it.
- Wait for price to test or pierce the upper band while RSI moves above 70 or turns from the overbought zone.
- Require a bearish rejection or engulfing candle to close back inside the band.
- Enter after the completed close, not at the first wick. Use the same three-to-five-candle test range.
- Cancel if the bands expand sharply upward, higher-timeframe structure remains strongly bullish or the signal arrives after a news impulse.
On an M15 chart, price returns to a resistance zone after two earlier failures. It closes briefly above the upper band while RSI reaches 74. The next candle rejects the high, closes inside the band and below the prior candle body. The plan is a 45–75 minute demo expiry. If price instead continues closing above the band with higher highs and widening bands, the reversal thesis is invalid.
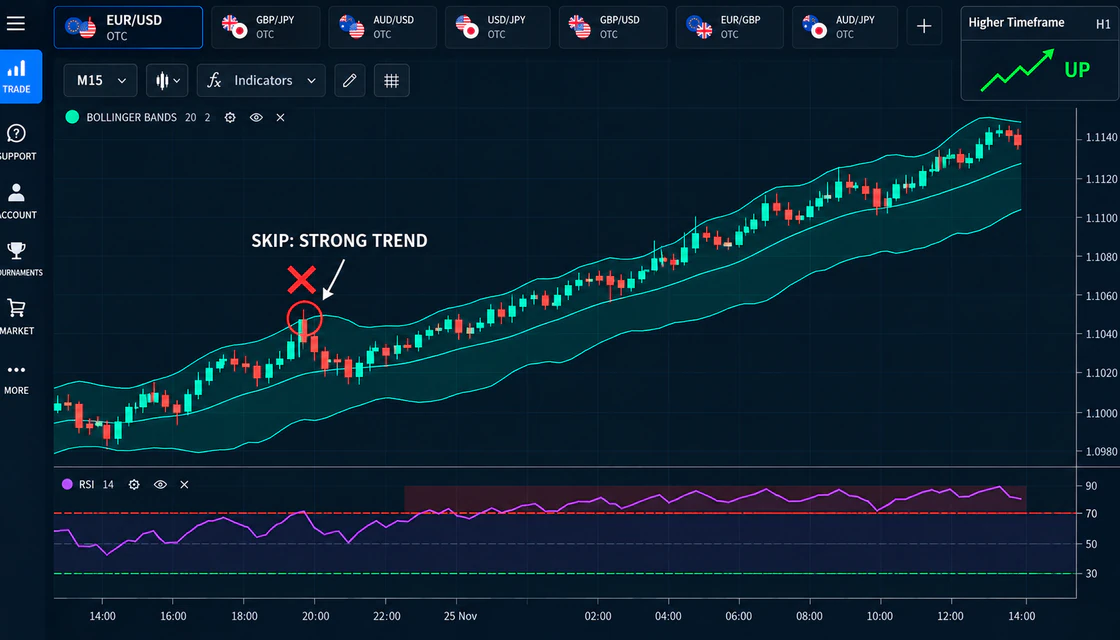
The Most Dangerous False Signal
A band walk occurs when price repeatedly closes near an outer band while the middle band slopes and the channel expands. RSI may remain above 70 in an uptrend or below 30 in a downtrend. This is not a broken indicator. It is evidence that trend strength is dominating mean reversion.
Confirmation that matters: Wait for price to stop making new trend extremes, break a recent swing, retest the broken structure and only then evaluate a reversal. RSI leaving 70 by itself is not enough.
| Reversal context | Band walk context |
|---|---|
| Outer band is relatively flat | Outer bands expand in trend direction |
| Price reacts at established level | Price prints new swing highs or lows |
| RSI exits the extreme | RSI stays extreme for many candles |
| Candle closes back inside band | Candles repeatedly close at the band |
| Middle band flattens | Middle band slopes strongly |
| Reasonable reversal idea | Skip or wait for structure to break |
Filters That Remove Weak Trades
| Filter | Pass condition | Skip condition |
|---|---|---|
| Support or resistance | Signal overlaps a pre-marked reaction zone | Signal appears in empty chart space |
| Market regime | Range or controlled pullback | Accelerating trend or chaotic whipsaw |
| Band behavior | Touch followed by close inside | Repeated closes riding expanding band |
| RSI behavior | Extreme followed by visible turn | Extreme continues with price acceleration |
| Candle | Completed rejection or engulfing close | Unfinished candle or oversized news bar |
| Timing | Entry remains near the level | Reaction already moved several candles |
| News | No major release near expiry | High-impact event can dominate signal |
How to Choose Expiry
Expiry should be derived from chart rhythm, not from impatience. The indicators are calculated from candles, so an expiry shorter than the confirmation pattern often turns a sound idea into a timing gamble. Start with a fixed number of candles and compare results without changing the rule mid-sample.
- Do not shorten expiry because the entry was late. Skip the late entry.
- Do not extend expiry after opening a trade to rescue a poor signal.
- Compare exactly one expiry rule for at least 30 demo cases.
- Separate regular-market and OTC samples because behavior may differ.
| Chart timeframe | Demo range | Use only when |
|---|---|---|
| M1 | 3–5 minutes | You accept high noise and have a separate M1 sample |
| M5 | 15–25 minutes | The setup is confirmed and price remains near the level |
| M15 | 45–75 minutes | Structure is clean and no major event falls inside expiry |
| M30 | 90–150 minutes | The platform offers the duration and the session remains relevant |
Payout and Break Even Math
Chart quality is only half of the decision. If a winning trade returns less than the amount risked, the strategy needs a win rate above 50% just to break even. The required break-even rate is 1 divided by 1 plus the payout expressed as a decimal.
This calculation ignores execution differences and assumes the full stake is lost on a losing trade. A strategy that looks profitable at an 85% payout may not remain profitable at 60%. Record the actual payout for every demo or live case instead of relying on an average remembered later.
| Displayed payout | Break-even win rate | Wins needed per 100 trades |
|---|---|---|
| 60% | 62.5% | About 63 |
| 70% | 58.8% | About 59 |
| 80% | 55.6% | About 56 |
| 85% | 54.1% | About 55 |
| 90% | 52.6% | About 53 |
Risk Rules
- Choose a fixed amount before the session. A conservative demo benchmark is 0.5%–1% of the practice balance per attempt.
- Never use Martingale or increase size to recover a loss. One failed signal does not make the next signal stronger.
- Stop after two or three full-risk losses, or after the maximum number of trades defined in the plan.
- Use one asset and one timeframe per test block so the sample remains comparable.
- Avoid stacking correlated positions that depend on the same currency or market move.
- Score rule adherence separately from profit. A valid setup can lose and an invalid setup can win.
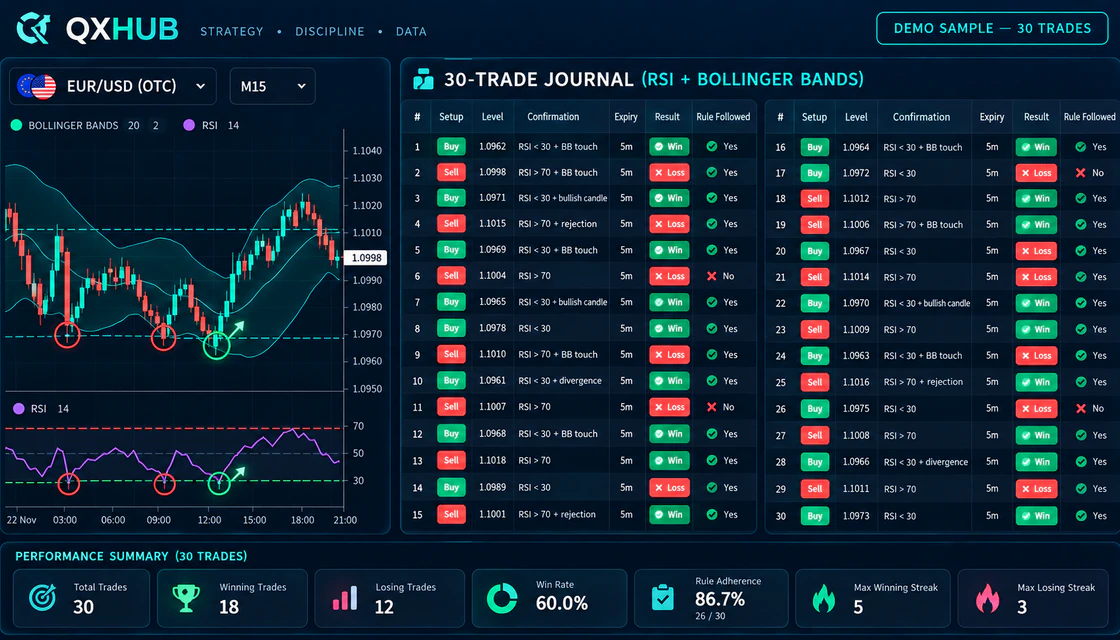
Thirty Trade Demo Protocol
- Choose one asset, one timeframe, one session window and one expiry rule.
- Save a screenshot before entry showing the level, bands, RSI and confirmation candle.
- Record direction, market regime, RSI reading, band event, candle type, expiry, payout and result.
- Mark whether every one of the five gates was followed. Do not rewrite the reason after seeing the outcome.
- Save a second screenshot at expiry and write one sentence about what invalidated or confirmed the idea.
- After 30 cases, calculate win rate, rule adherence, average payout and maximum losing streak.
- Compare valid trades with rule-breaking trades. Improve the rule only if a repeated failure pattern appears.
| Journal field | Example |
|---|---|
| Asset and session | EUR/USD, London–New York overlap |
| Market regime | Range at pre-marked support |
| Signal | Lower-band test, RSI 27 to 32 |
| Confirmation | Bullish engulfing close inside band |
| Expiry | 4 candles on M5 |
| Payout | 82% displayed before entry |
| Result | Loss |
| Process grade | Valid setup; no rule broken |
| Review note | Reaction was correct but developed after expiry |
Common Mistakes
| Mistake | Why it fails | Better rule |
|---|---|---|
| Trading every band touch | Bands identify extension, not reversal | Require level, RSI turn and candle close |
| Selling every RSI reading above 70 | Strong trends can stay overbought | Check structure and band slope first |
| Entering before candle close | The wick and RSI can change before close | Evaluate only completed candles |
| Drawing a level after the signal | Creates hindsight confirmation | Mark levels before the setup |
| Changing settings after two losses | Destroys comparability | Finish a 30-case sample first |
| Using Martingale | Raises exposure after uncertainty | Keep amount fixed and use a stop rule |
| Mixing OTC with regular markets | Conditions and rhythm may differ | Maintain separate journal samples |
Pre Trade Checklist
| Question | Check |
|---|---|
| Is the market a range or controlled pullback rather than a strong band walk? | □ |
| Was support or resistance marked before the signal? | □ |
| Did price test the correct outer band? | □ |
| Did RSI reach and then turn from the relevant zone? | □ |
| Did a completed candle close back inside the band? | □ |
| Is the entry still near the level rather than late? | □ |
| Does the expiry match three to five chart candles? | □ |
| Is major news absent from the trade window? | □ |
| Are amount, payout and daily stop confirmed? | □ |
Conclusion
The RSI and Bollinger Bands strategy works best as a disciplined filter. Bollinger Bands locate price extension. RSI measures momentum. Support or resistance provides location, a completed candle provides timing, and expiry determines whether the reaction has enough room to develop. None of those layers should be replaced by a single indicator reading.
For a beginner, the strongest version is deliberately simple: Bollinger Bands 20,2, RSI 14, one asset, one timeframe and one fixed expiry rule. Practise thirty documented cases, separate valid setups from rule breaks and judge the process before the outcome. The most valuable signal will often be the one that tells you to wait.
Quick answers
What are the best RSI and Bollinger Bands settings for Quotex
Start with RSI 14 using 70 and 30 levels, and Bollinger Bands period 20 with deviation 2. Keep them fixed during the first demo sample. Settings do not replace market structure or confirmation.
Does a lower Bollinger Band touch mean UP
No. It shows that price is extended relative to its recent average. Consider an UP idea only when the touch aligns with support, RSI turns from oversold and a completed bullish candle closes back inside the band.
Can RSI stay overbought or oversold
Yes. During strong trends RSI can stay above 70 or below 30 while price continues in the same direction. Expanding bands and repeated closes near an outer band are reasons to avoid an early reversal.
Which timeframe is best for beginners
M5 and M15 are practical starting points because the structure and confirmation are easier to read than on ultra-short charts. The correct choice is the one tested consistently with a fixed expiry rule.
How many trades are needed to test the strategy
Use at least 30 comparable demo cases for an initial review, then extend the sample before risking money. Separate assets, sessions, regular markets and OTC conditions when their behavior differs.
Is the strategy guaranteed to be profitable
No. Every setup can lose. Profitability depends on signal quality, payout, expiry, risk control and execution. The purpose of the strategy is to create repeatable decisions, not certainty.
Next step
Choose a topic by task: brokers for platform selection, guides for access, strategies for setups, risk for discipline and investing for longer market logic.