reversal trading strategy Quotex
Reversal Trading Strategy on Quotex: How to Confirm a Real Market Turn
Learn a confirmation-first Quotex reversal strategy using support and resistance, candle closes, RSI or MACD divergence, structure breaks, expiry logic and fixed risk.

Key points
- Treat a reversal as a change in market structure, not a single candle or an overbought or oversold reading.
- Require meaningful location, weakening momentum, a closed confirmation candle and a visible structure shift.
- Use RSI or MACD as supporting evidence rather than a standalone entry command.
- Match expiry testing to several completed chart candles instead of the next few seconds.
Reversal Trading Strategy on Quotex: How to Confirm a Real Market Turn
Reversal trading attracts beginners for an obvious reason: catching the moment a trend changes can look clean and powerful on a finished chart. In real time, however, the same area is crowded with failed bounces, shallow pullbacks and price spikes that disappear before the candle closes.
A professional reversal process is therefore not a prediction game. It is a confirmation game. Your job is not to call the exact top or bottom. Your job is to identify a meaningful location, wait for evidence that the current side is losing control, then enter only when price proves that control may be changing hands.
What Counts as a Reversal?
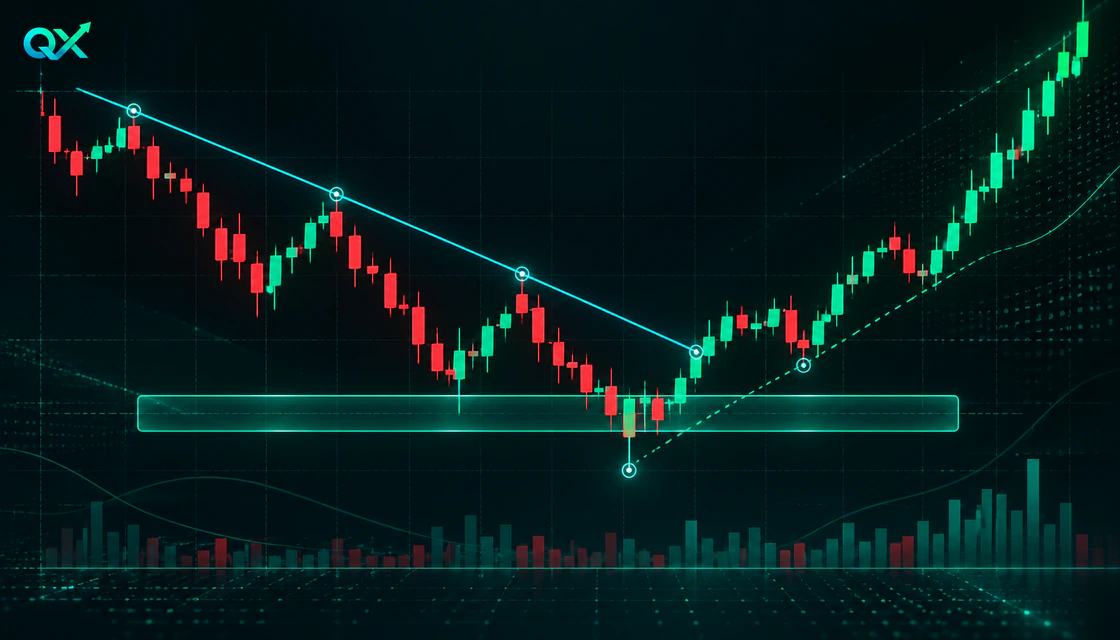
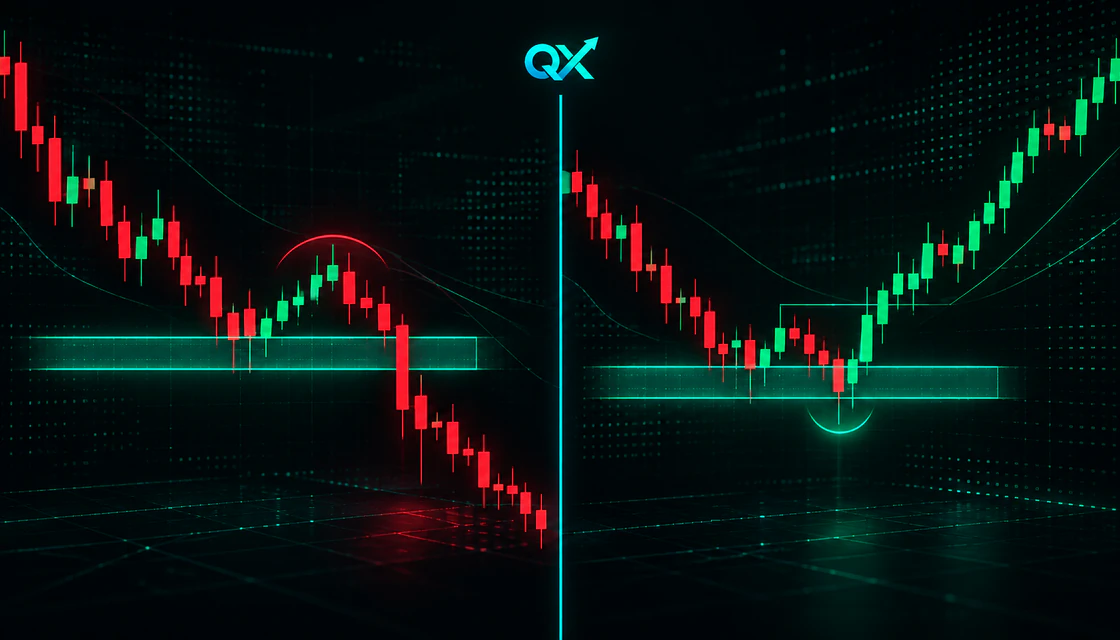
A reversal is a change in directional control. In a bullish reversal, sellers stop producing lower lows, buyers defend a meaningful area, and price begins to print higher lows or breaks a prior swing high. A bearish reversal is the mirror image: buyers fail to extend higher, sellers defend resistance, and price breaks the structure that supported the rise.
This is different from a pullback. A pullback temporarily moves against the trend while the original structure remains intact. If an uptrend still has higher highs and higher lows, one red candle is not a bearish reversal. Likewise, an RSI reading above 70 is not an automatic DOWN signal; strong trends can stay overbought for many candles.
The Three Conditions Every Setup Needs
1. Location: Price Must Be Somewhere That Matters
Begin with the chart, not the indicator. Mark the nearest support or resistance zone that produced a visible reaction before. The best zones are obvious without zooming in: a prior swing high or low, the neckline of a major pattern, a range boundary, or a level tested more than once.
Treat levels as zones, not perfect lines. Price often probes beyond a level to find liquidity before returning. A wick through support is not a failure if the candle closes back above the zone; it may be the rejection you need. A full-bodied close through the zone is a different message and should usually cancel the reversal idea.
2. Exhaustion: Momentum Stops Confirming Price
Exhaustion means the trend is still moving, but its internal force is weakening. You may see smaller candle bodies, repeated long wicks, slower progress, or divergence between price and a momentum indicator. Bullish RSI divergence occurs when price makes a lower low while RSI makes a higher low. Bearish divergence occurs when price makes a higher high while RSI makes a lower high.
Divergence is an alert, not an entry. It tells you to watch the level more closely. A trend can continue after divergence, especially during high volatility. That is why price confirmation remains mandatory.
3. Confirmation: Structure Shows a Change of Control
Confirmation can be a strong rejection candle that closes back inside the zone, a bullish or bearish engulfing candle, a double top or double bottom neckline break, or a break of the most recent countertrend swing. Stronger setups combine a candle close with a structure break or retest. The later entry sacrifices a little price precision in exchange for better information.
The QX HUB Four-Layer Confirmation Stack
| Step | Rule |
|---|---|
| 1 | Mark the decision zone. Use a prior swing, range boundary or neckline. If you cannot explain why the level matters in one sentence, skip it. |
| 2 | Read momentum. Look for loss of speed, rejection wicks or RSI/MACD divergence. Do not enter from the oscillator alone. |
| 3 | Wait for the candle close. A pattern exists only after the candle closes. Mid-candle shapes can change completely in the final seconds. |
| 4 | Demand structure confirmation. For an UP idea, price should defend support and break a recent lower high. For a DOWN idea, it should reject resistance and break a recent higher low. |

Indicator Settings: Keep the Chart Readable
Use either RSI or MACD as the main momentum tool at first. Loading both plus several extra oscillators can create false confidence because many indicators are derived from the same price data. More indicators do not necessarily mean more independent evidence.
| Tool | Starting setting | What it contributes | What it cannot prove |
|---|---|---|---|
| RSI | 14 periods | Momentum, overextension and divergence | That price must reverse now |
| MACD | 12, 26, 9 | Momentum contraction, crossover and divergence | A precise entry by itself |
| Support / resistance | Manual zones | Location and invalidation | Direction without confirmation |
| Candlesticks | Clean chart | Rejection and close quality | A reversal away from context |
| Optional EMA | 50 period | Trend context and dynamic reaction | A guaranteed barrier |
Bullish Reversal Setup: Step by Step
| Step | Rule |
|---|---|
| 1 | Find an established decline. Price should have a visible sequence of lower highs and lower lows, not random sideways candles. |
| 2 | Mark support before price arrives. Prefer a prior swing low or range floor visible on the same or one higher timeframe. |
| 3 | Watch for seller exhaustion. Look for smaller bearish bodies, long lower wicks or bullish RSI/MACD divergence. |
| 4 | Wait for bullish confirmation. A hammer, bullish engulfing candle or strong close back above support is useful only after it closes. |
| 5 | Confirm the structure shift. Price breaks the nearest lower high or the neckline of a double bottom. A controlled retest adds quality. |
| 6 | Set direction and expiry deliberately. For a 5-minute chart, begin demo testing around three to five candles of expiry, then record results instead of changing it after each trade. |
Bearish Reversal Setup: Step by Step
Reverse the logic. Start with a clear rise into resistance. Look for shrinking bullish progress, upper rejection wicks or bearish divergence. Wait for a shooting star, bearish engulfing candle or decisive close back below the zone. Confirmation improves when price breaks the nearest higher low or a double-top neckline. A failed retest of broken support can become the final trigger for a DOWN idea.
Worked Example: EUR/USD on a 5-Minute Chart
Imagine EUR/USD has fallen for 45 minutes and is approaching a support zone that produced two earlier rebounds. Price briefly prints a lower low, but RSI makes a higher low. The next candle forms a long lower wick, yet it is still open. There is no entry.
The candle closes back above support. The following candle breaks the most recent lower high and closes above it. The setup now has four elements: meaningful location, bullish divergence, a closed rejection candle and a structure break. A trader could test an UP position only after the break is confirmed, using an expiry aligned with several 5-minute candles rather than the next 30 seconds.
| Decision | Observation | Action |
|---|---|---|
| Context | Clear short-term downtrend into known support | Watch; do not pre-empt |
| Momentum | Price lower low, RSI higher low | Add divergence to checklist |
| Candle | Long lower wick, then close above support | Confirmation layer passed |
| Structure | Break and close above recent lower high | Entry becomes testable |
| Expiry | 5-minute chart | Demo-test 15–25 minutes |
| Invalidation | Strong close back below support | Skip or mark setup failed |
False Reversal vs Confirmed Reversal
| Early trap | Confirmed setup |
|---|---|
| Entry is based on “overbought” or “oversold” alone. | Signal forms at a pre-marked support or resistance zone. |
| Trader enters before the candle closes. | Reversal candle closes with clear rejection. |
| Original trend structure is still intact. | A recent swing or neckline breaks. |
| Expiry is much shorter than the analysis timeframe. | Expiry allows several candles for the idea to develop. |
| Entry happens during a news spike or thin liquidity. | Market conditions are orderly enough to read. |
When to Skip the Trade
- Price is in the middle of a range with no nearby decision level.
- Candles overlap heavily and alternate color with no clean swing structure.
- The supposed reversal is only an RSI 70/30 reading without price confirmation.
- A major scheduled economic release is imminent or volatility has already become erratic.
- The confirmation candle is abnormally large, leaving poor timing and a likely emotional entry.
- The level has been pierced and accepted with multiple full-bodied closes.
- The available payout or platform conditions make the trade unattractive.
- You have already reached your daily loss limit or are tempted to recover a previous loss.
Expiry Logic: Match the Clock to the Setup
Expiry is part of the strategy, not an afterthought. A reversal needs time to move from rejection to follow-through. If you analyze a 5-minute chart but choose a 30-second expiry, normal noise can decide the result before the pattern has a chance to develop.
These are testing ranges, not universal rules. Record results by asset, session and setup type. Do not optimize from a handful of trades; use a meaningful sample and keep variables stable.
| Analysis chart | Demo starting range | Reasoning |
|---|---|---|
| 1 minute | 3–5 minutes | Allows several candles; still highly noisy |
| 5 minutes | 15–25 minutes | Matches three to five completed candles |
| 15 minutes | 45–75 minutes | Gives structure time to confirm and follow through |
Risk Management for Reversal Trading
Reversal setups are countertrend at the beginning, which makes risk discipline non-negotiable. Even a textbook level can fail. Treat every position as an independent experiment with a known maximum loss.
- Use a fixed position size. A conservative demo benchmark is 0.5%–1% of the account per trade; choose a level you can follow consistently.
- Do not use Martingale or increase stake size after a loss. A losing sequence can expand faster than your edge can recover.
- Set a daily stop before the session, such as two or three full-risk losses. Stop when it is reached.
- Avoid multiple positions on highly correlated assets at the same time; they can behave like one oversized bet.
- Grade process separately from outcome. A valid setup can lose, and a poor setup can win. Only the former belongs in the strategy sample.
Common Beginner Mistakes
| Mistake | Why it fails | Better habit |
|---|---|---|
| Calling every wick a reversal | Wicks are common inside strong trends | Require close + structure |
| Selling RSI above 70 | Momentum can remain extreme | Use RSI as context |
| Entering before close | Pattern can disappear | Wait for completed candle |
| Ignoring the larger trend | Small reversal may be a pullback | Check one higher timeframe |
| Changing indicators after losses | Destroys a clean sample | Keep settings stable |
| Chasing a huge confirmation candle | Entry becomes emotional and late | Skip and wait for retest |
| Martingale recovery | Concentrates risk after failure | Use fixed stake and daily stop |
30-Setup Demo Practice
Practice only one direction and one timeframe for the first ten examples. This reduces noise and makes pattern recognition easier. Then complete the remaining sample without changing settings.
| Step | Rule |
|---|---|
| 1 | Choose one market and session. For example, EUR/USD during the same two-hour window. Consistency matters more than variety. |
| 2 | Fix the setup rules. Use support/resistance, RSI 14, closed-candle confirmation and one structure rule. |
| 3 | Capture every candidate. Save a screenshot before entry and after expiry, including valid setups you skip. |
| 4 | Log the variables. Record level quality, divergence, candle pattern, structure break, expiry, result and process score. |
| 5 | Review after 30 cases. Compare confirmed setups with early entries. Change only one variable for the next sample. |

Pre-Trade Checklist
| Check | Yes / No |
|---|---|
| A clear trend or directional move exists | □ |
| Price is at pre-marked support or resistance | □ |
| Momentum is weakening or diverging | □ |
| Reversal candle has fully closed | □ |
| A recent swing / neckline has broken | □ |
| Expiry matches several chart candles | □ |
| No imminent high-impact event | □ |
| Stake and daily stop are within plan | □ |
Summary
The most reliable way to approach reversals on Quotex is to stop trying to predict the final tick of a trend. Start with a meaningful level, look for exhaustion, wait for the candle to close, and then demand a visible structure change. Use RSI or MACD as supporting evidence, not as a command. Align expiry with the analysis timeframe, keep stake size fixed, and validate the process through a controlled demo sample.
The edge is not one magic pattern. It is the discipline to reject incomplete setups.
Quick answers
What is the best reversal indicator for Quotex?
There is no single best indicator. RSI and MACD can reveal momentum loss or divergence, but price location and a closed-candle structure signal should carry more weight.
Does RSI above 70 mean I should trade DOWN?
No. It means recent upward momentum is strong or extended. Price can remain overbought. Wait for resistance, rejection and structure confirmation.
Which candlestick patterns work for reversals?
Hammers, shooting stars, bullish or bearish engulfing candles and pin bars can help when they close at a meaningful level. The same pattern in the middle of noise has little value.
Should I enter on the reversal candle?
A conservative method waits for the candle to close. An even stricter method waits for a swing or neckline break, or a retest after that break.
What expiry should I use on a 5-minute chart?
A practical demo starting point is three to five candles, or roughly 15–25 minutes. Test it consistently; market conditions vary.
Can this strategy guarantee profitable trades?
No. Every reversal setup can fail. The objective is a repeatable process with controlled losses, not certainty.
Does the strategy work in sideways markets?
Only near clear range boundaries. Avoid the middle of a choppy range, where levels and direction are ambiguous.
How many demo trades should I test?
Start with at least 30 documented setups under the same rules. Larger samples across different conditions provide more useful evidence.
Next step
Choose a topic by task: brokers for platform selection, guides for access, strategies for setups, risk for discipline and investing for longer market logic.