binary options market correlation
Binary Options Market Correlation: How to Avoid Hidden Risk and Read Related Assets
Learn how market correlation affects binary options, how related assets can multiply risk, and how to verify relationships with a practical checklist and demo test.

Key points
- Use correlation as context and a concentration-risk filter, not as a standalone entry signal.
- Measure matching return series over a window that fits the planned timeframe, session and expiry.
- Group trades that share one driver and keep their combined exposure inside one written risk limit.
Why Market Correlation Matters Before a Trade
Market correlation helps explain why different charts sometimes move together, move in opposite directions, or react to the same news at nearly the same moment. For a binary options trader, the main value is not prediction. It is risk awareness. Two trades on different assets may look diversified while actually depending on one shared market driver.
That matters because binary options have a fixed expiry and an asymmetric payout. If several correlated positions expire during the same market move, one wrong assumption can affect all of them at once. Correlation therefore belongs in the pre-trade checklist, beside payout, volatility, news, expiry and stake size.
This guide explains correlation in plain language, shows where beginners misuse it, and gives a repeatable process for checking related assets without turning correlation into a signal. All examples are educational and broker-neutral. Platform availability, pricing sources and asset schedules differ, so verify the conditions shown by your own platform.
What Is Market Correlation?
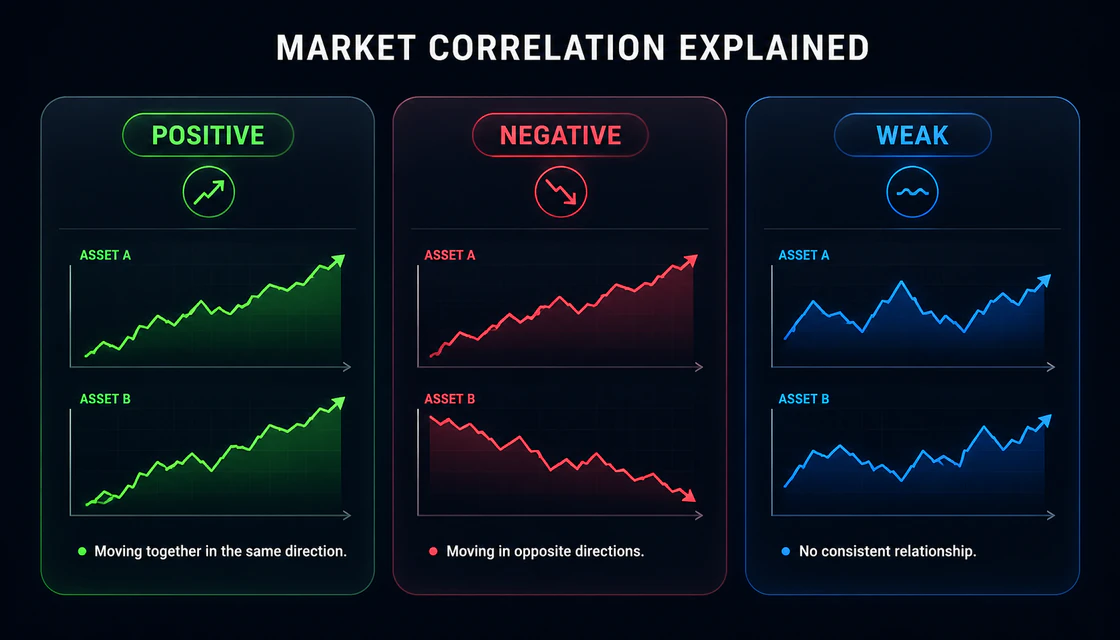
Correlation is a statistical description of association between two variables. A common correlation coefficient ranges from -1 to +1. A value near +1 describes strong same-direction movement, a value near -1 describes strong opposite-direction movement, and a value near zero describes little consistent linear relationship in the selected sample.
The phrase selected sample is essential. A coefficient is never a permanent label attached to an asset pair. It depends on the observations used: one hour, one session, thirty daily closes or another window. A relationship that looks strong on a daily chart can disappear on one-minute candles. A single news spike can also distort a small sample.
These bands are learning aids, not universal trading rules. The coefficient must be interpreted with the window, chart interval, liquidity, session and current event risk.
| Coefficient area | Plain-language reading | Trading meaning |
|---|---|---|
| +0.70 to +1.00 | Strong positive association | Treat same-direction trades as potentially concentrated. |
| +0.30 to +0.69 | Moderate positive association | Check whether a shared driver is active now. |
| -0.29 to +0.29 | Weak linear association | Do not assume the assets will confirm each other. |
| -0.69 to -0.30 | Moderate negative association | Opposite movement may occur, but verify the regime. |
| -1.00 to -0.70 | Strong negative association | Opposite-direction exposure may still reflect one driver. |
Why Correlation Matters in Binary Options
One market idea can become several simultaneous bets
Suppose a trader sees broad U.S. dollar weakness and opens upward trades on EUR/USD and GBP/USD while also choosing an upward gold trade. The instrument names differ, but the positions may all depend on the same dollar move continuing. If the dollar reverses before expiry, all three ideas can fail together.
Expiry compresses the relationship into a deadline
A longer-term relationship does not guarantee that two assets will align during a three-minute or five-minute expiry. One asset can react faster, another can lag, and the relationship can normalize only after the option has settled. Correlation must therefore match the decision horizon, not merely a chart remembered from last week.
A second chart can improve context without becoming confirmation
Watching a related asset can help explain whether movement is broad or isolated. But a correlated chart is not automatic confirmation. The target asset still needs its own structure, level, candle close, volatility and expiry logic. A clean move in gold cannot repair a poor entry location in EUR/USD.

Correlation Is Not Causation
Two assets can move together because both respond to a third factor: interest-rate expectations, inflation data, risk sentiment, commodity demand or a currency move. One chart may also lead temporarily while the other adjusts later. The relationship alone does not prove which asset caused the move.
This distinction protects the trader from a common story-making error. After seeing two charts align, a beginner may invent a fixed rule such as “gold rises whenever the dollar falls.” In reality, gold can also respond to real yields, inflation expectations, safe-haven demand, liquidity and positioning. The observed relationship can weaken or reverse.
Professional use of correlation is conditional: these assets have recently behaved in a related way, during this window, under these conditions. That is a far safer statement than declaring that one asset must follow the other.
Common Correlation Relationships to Study
The following examples are starting points for observation, not permanent signals. Always inspect current data on the same time interval used for the planned decision.
| Relationship | Why a link may appear | Why it can break |
|---|---|---|
| EUR/USD and GBP/USD | Both quote major European currencies against USD. | UK- or euro-area-specific news can separate them. |
| USD index and major USD pairs | Several currency pairs react to broad dollar strength or weakness. | Index composition and local currency news create differences. |
| Gold and the U.S. dollar | Dollar pricing and macro expectations may create inverse periods. | Real yields, risk demand and commodity flows can dominate. |
| Oil and CAD-related markets | Canada is a major energy exporter, so energy conditions can matter. | Domestic data, policy expectations and risk sentiment can take control. |
| Equity indices and risk currencies | Risk-on or risk-off flows can affect several markets together. | Sector news, local policy and session timing may cause divergence. |
| Crypto assets | Large tokens often share liquidity and sentiment drivers. | Token-specific events, listings or protocol news can break alignment. |
How to Check Correlation Before a Trade
A trader does not need a complex institutional terminal. The goal is to test whether a claimed relationship is relevant to the current decision. Use the same process every time so the second chart adds information rather than distraction.
- Define the exact decision window. Write the target asset, chart timeframe and expiry. A correlation measured on daily returns may be irrelevant to an M5 setup.
- Select one logically related comparison asset. Choose it because a shared driver is plausible, not because two charts happened to look similar once.
- Compare returns or directional changes over the same timestamps. Do not compare raw price levels: EUR/USD at 1.10 and gold at 2,400 cannot be meaningfully compared by level.
- Mark the current session and scheduled news. Ask whether one event is capable of driving both assets or separating them.
- Inspect the target chart independently. Require its own setup, trigger and confirmation. The related asset is context, not permission.
- Check existing exposure. If another open trade depends on the same driver and expires in the same window, treat the new position as added concentration.
- Choose trade or skip. If the relationship is unclear, unstable, delayed or news-distorted, remove correlation from the decision rather than forcing an interpretation.

A Simple Correlation Calculation
Most charting or spreadsheet tools can calculate Pearson correlation. The practical input should be percentage changes or returns over matching timestamps, not the absolute price of each asset. In a spreadsheet, create one column of Asset A returns and one column of Asset B returns, then apply the correlation function to the same rows.
For example, if both assets have 30 matching five-minute return observations, the coefficient summarizes their linear association during those 150 minutes. It says nothing certain about observation 31. If the result changes sharply when five more rows are added, the relationship is not stable enough to carry much weight.
| Check | Acceptable practice | Red flag |
|---|---|---|
| Time alignment | Both series use identical timestamps. | Missing or shifted candles. |
| Input type | Percentage changes or returns. | Comparing raw price levels. |
| Window | Chosen before viewing the result. | Changing the window until it looks strong. |
| Sample | Large enough for the intended review. | Five dramatic candles treated as proof. |
| Stability | Repeated across several comparable sessions. | Coefficient collapses after a few new rows. |
Timeframes, Sessions and Changing Correlation
Intraday correlation is regime-dependent
During the London-New York overlap, major currency pairs may respond together to U.S. data. Later, a UK-specific release can separate GBP/USD from EUR/USD. A relationship measured across the entire day can hide these smaller regimes. For short-expiry decisions, session-level context matters more than a broad historical average.
News can strengthen or destroy the relationship
A shared macro release can synchronize markets for a few minutes, but the first reaction may be too volatile for a controlled entry. Conversely, asset-specific news can break a previously stable relationship. Correlation should never override the economic calendar or a restricted-news rule.
OTC and weekend symbols need a separate dataset
OTC symbols may use a different pricing environment or schedule from regular exchange-linked markets. Do not transfer a weekday correlation assumption into an OTC session. If you study OTC assets, record and test them as a separate market category using the exact symbols and hours offered by the platform.
How Correlated Trades Multiply Risk
Risk per trade is necessary but incomplete. If a trader risks 1% on each of three highly related ideas, the account may effectively face a clustered 3% decision around one driver. The outcomes will not always be identical, but the assumption of three independent trades is unsafe.
A practical rule is to create a correlation group. Trades that share the same dominant driver, direction and expiry window belong to one group. Set a maximum total stake for that group. For example, if the normal risk budget is 1% per idea, the trader might divide that 1% among two related entries rather than placing 1% on each. The precise limit must be tested and written in the trading plan before the session.
Complete Correlation Checklist
- I know the target asset, timeframe and expiry.
- I am comparing matching timestamps and return changes, not raw prices.
- The relationship has a logical shared driver.
- I checked the relevant economic calendar and current session.
- The target asset has its own valid setup and completed trigger.
- The related asset confirms context but is not my sole entry reason.
- I counted existing trades linked to the same driver.
- My total correlation-group risk stays inside the written limit.
- I will skip the trade if the relationship is unstable, delayed or news-distorted.
Worked Educational Example
Scenario: EUR/USD is in a short-term uptrend and pulls back to a previously respected support zone. GBP/USD is also firm during the same London session. A scheduled U.S. release is more than an hour away, payout meets the trader’s minimum, and the EUR/USD candle closes back above support.
What the trader did correctly: the trade was based on EUR/USD structure, not on GBP/USD alone; the comparison used the same session; news and payout were checked; and correlated exposure was counted before entry.
What cannot be concluded: one aligned example does not prove a stable relationship, validate the setup or predict the next outcome. The trader needs a larger sample across comparable sessions, including every valid case rather than only attractive screenshots.
| Field | Example entry |
|---|---|
| Target asset | EUR/USD |
| Related asset | GBP/USD |
| Shared driver | Broad USD weakness during the current session |
| Target setup | Uptrend pullback to support |
| Trigger | Bullish close after rejection |
| Timeframe / expiry | M5 chart / pre-tested multi-candle expiry |
| Existing correlated exposure | None |
| Risk | Fixed amount within one correlation-group limit |
| Skip condition | GBP/USD divergence, news-window conflict, poor payout or weak EUR/USD close |
When to Ignore Correlation or Skip the Trade
- The assets are being compared across different timestamps or market hours.
- The relationship exists only because of one extreme candle.
- A major release is imminent and the expiry crosses the event window.
- One asset has asset-specific news that can dominate the shared driver.
- The target chart has no valid setup, even though the second chart looks clean.
- The relationship appears with a long delay that exceeds the planned expiry.
- Payout is below the minimum required by the tested plan.
- Another open trade already uses the correlation-group risk budget.
- The trader is adding charts to justify an impulsive decision after a loss.
Beginner Mistakes With Market Correlation
| Mistake | Why it fails | Corrective rule |
|---|---|---|
| Treating correlation as causation | Association does not identify the true driver. | Name the possible common factor and keep the claim conditional. |
| Using raw price levels | Different units make the comparison misleading. | Compare percentage changes over matching timestamps. |
| Choosing the window afterward | It creates a result that fits the desired story. | Define the window before calculating. |
| Assuming correlation is permanent | Relationships shift by regime, session and news. | Recheck stability and date every observation. |
| Stacking correlated trades | Several positions may be one concentrated idea. | Apply one group-level risk cap. |
| Using a related asset as the trigger | The traded chart may have poor location or timing. | Require an independent setup on the target asset. |
| Ignoring payout and expiry | Correct context can still produce poor trade economics. | Keep payout and expiry inside the normal checklist. |
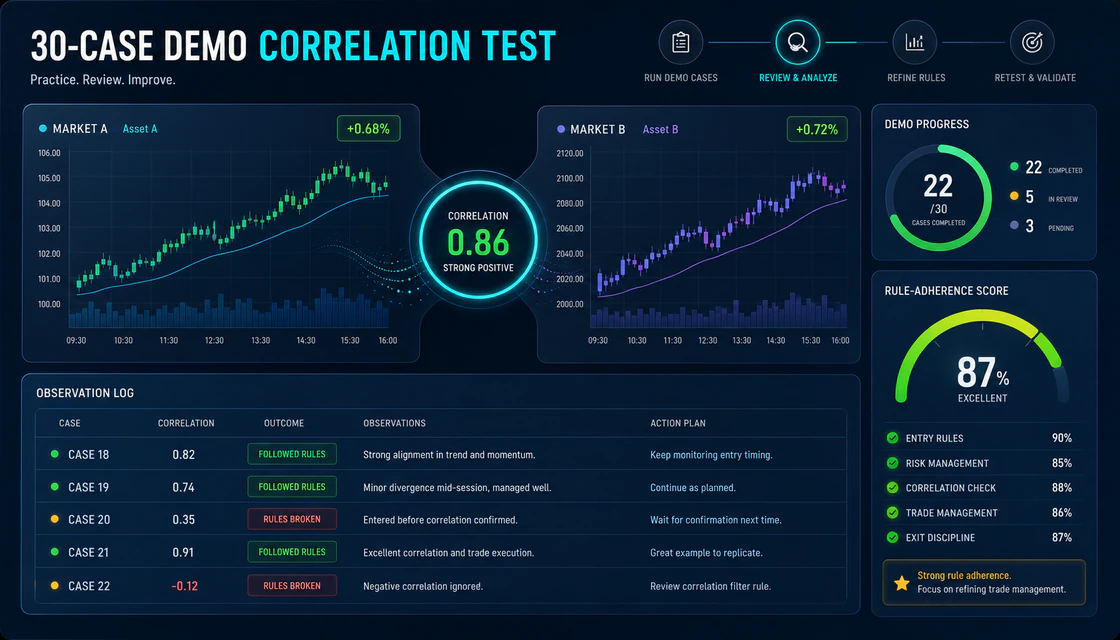
30-Case Demo Practice Task
Use a demo account and a spreadsheet or journal. Choose one relationship, such as EUR/USD and GBP/USD, and one fixed session window. Do not change the pair, timeframe or definition during the test.
- Collect 30 eligible cases, including aligned, divergent and skipped observations.
- Save screenshots of both charts with identical timestamps.
- Record timeframe, expiry, session, news status, payout and the suspected shared driver.
- Mark whether the target asset had an independent setup before checking the related chart.
- Record all correlation-group exposure that would have existed at the decision time.
- Separate process quality from trade result. A loss can follow correct rules; a win can come from a poor impulse.
- Review whether the relationship stayed useful across cases and whether it helped you skip concentrated or low-quality decisions.
- Change only one rule, then run a fresh validation sample. Do not rewrite the first sample to make the method look stronger.
Metrics Worth Tracking
- Number of eligible cases and number actually taken.
- Correlation coefficient for the predefined window.
- Coefficient stability across comparable sessions.
- Aligned, divergent and delayed reactions.
- Trades skipped because group risk was already full.
- Results with and without independent target-chart confirmation.
- Average payout and whether it met the plan.
- Rule-adherence rate, not only win rate.
- Performance with and without correlation-rule violations.
Avoid conclusions from a small sample. Thirty cases are a structured learning exercise, not proof of a durable edge. Continue collecting data and use an out-of-sample period before changing live-money decisions.
Final Thoughts
The best use of market correlation is defensive. It reveals when several charts are telling the same story, when exposure is less diversified than it appears, and when a second trade would simply repeat the first idea. It can also show that a relationship is too unstable to deserve weight.
Keep the hierarchy clear: the target chart provides the setup; correlation supplies context; expiry and payout define the trade conditions; group-level risk controls concentration; and the journal tests whether the rule helped. When those pieces disagree, skipping the trade is a complete professional decision.
Quick answers
What is correlation in binary options trading?
It is the measured association between two price series during a chosen window. It can show same-direction, opposite-direction or weak movement, but it does not predict the next expiry.
What does a correlation of +1 or -1 mean?
In theory, +1 is perfect same-direction linear movement and -1 is perfect opposite-direction linear movement in the sample. Real market relationships are rarely perfect or stable.
Which assets are correlated?
Major USD currency pairs, gold and the dollar, oil and some CAD-related markets, equity indices and risk-sensitive currencies, and large crypto assets can show relationships. None should be treated as permanent.
Can correlation be used as an entry signal?
It is better used as context and a risk filter. The traded asset still needs its own setup, trigger, payout, expiry and news checks.
What timeframe should I use?
Use a window relevant to the planned decision and compare identical timestamps. A daily correlation may not help a five-minute expiry.
How often should correlation be recalculated?
Recheck it whenever the session, news regime, volatility or sample changes. Record the date and window rather than storing one timeless number.
Does negative correlation eliminate risk?
No. Opposite movement is not guaranteed, the relationship can break, and binary options still have fixed-loss exposure.
How should correlated trades be sized?
Group positions that share one driver and apply a written maximum total risk to the group. Do not automatically apply the full per-trade amount to each correlated entry.
Does correlation work on OTC assets?
OTC symbols should be tested separately using their own schedule and pricing environment. Do not import weekday market relationships without evidence.
Can correlation make a strategy profitable?
No. It can improve awareness and decision consistency, but profitability also depends on payout, edge, execution, risk, platform integrity and a sufficiently large validated sample.
Next step
Choose a topic by task: brokers for platform selection, guides for access, strategies for setups, risk for discipline and investing for longer market logic.