binary options break-even win rate
Binary Options Break-Even Win Rate: Formula, Payout Table and Practical Guide
Calculate the binary options break-even win rate from the actual payout, compare thresholds, measure expected value and validate a strategy with a controlled demo sample.

Key points
- Calculate break-even as 1 / (1 + payout as a decimal) when an unsuccessful trade loses the full stake.
- Use the payout shown for each trade: a lower payout raises the accuracy required to break even.
- Validate one unchanged setup with fixed stakes and a controlled demo sample before interpreting a win rate as evidence.
Why Win Rate Alone Can Mislead You
A trader says that a strategy wins 55% of the time. Is that good? The honest answer is: you still do not know. If a winning fixed-time trade earns 90% of the stake, a 55% win rate is above the mathematical break-even point. If the payout is 70%, the same 55% accuracy loses money over a sufficiently large series. The chart setup did not change; the payoff structure changed the result.
This is the central arithmetic many beginners miss. Binary options usually have an asymmetric outcome: an unsuccessful trade loses the full stake, while a successful trade earns less than the stake as profit. Because one loss is larger than one win, the strategy must win more than half its trades just to stand still. More wins than losses is not a complete performance test.
This guide builds the calculation from first principles and turns it into a practical trading routine. You will learn the standard formula, a payout reference table, expected-value examples, how refunds alter the result, why changing payouts can invalidate a test, what sample size can and cannot tell you, and how to run a controlled demo validation. The material applies across platforms because it describes the contract mathematics rather than one broker interface.
What Is the Break-Even Win Rate?
The break-even win rate is the percentage of trades that must finish successfully for total profit from wins to equal total loss from unsuccessful trades. At the exact threshold, the series is flat before any extra costs, rounding, execution differences or operational mistakes. Above the threshold, the sample has positive arithmetic expectancy under the assumed payout. Below it, expectancy is negative.
Break-even does not mean safe, consistent or validated. A strategy can finish above its theoretical threshold by luck in a short sample. It can also have a genuine historical advantage that disappears when volatility, asset behavior, payout or execution changes. The calculation tells you the minimum hurdle; it does not prove that your method can clear it in the future.
| Term | Meaning | What it does not mean |
|---|---|---|
| Payout | Profit earned on a winning trade as a percentage of stake | Total account return or guaranteed reward |
| Win rate | Winning trades divided by resolved trades | Quality without considering payout |
| Break-even win rate | Accuracy required for wins to offset losses | A recommended target or safety guarantee |
| Expected value | Average result per trade under stated assumptions | A promise that the next trade will win |
| Edge margin | Observed win rate minus break-even rate | Proof unless supported by a suitable sample and stable rules |
The Binary Options Break-Even Formula
Assume every trade uses the same stake, a win returns the stake plus a fixed percentage of profit, and a loss removes the full stake. Write the payout as a decimal: 80% becomes 0.80. Let p represent the probability of a win. The probability of a loss is 1 - p. At break-even, expected profit equals expected loss.
For an 80% payout: 1 / (1 + 0.80) = 1 / 1.80 = 0.5556, or 55.56%. A trader therefore needs more than approximately 55.56% successful trades to produce positive arithmetic expectancy under that exact payout and a full loss on unsuccessful trades.
Stake size does not change the percentage threshold when every trade uses the same size. A $1 stake and a $100 stake have the same break-even win rate. The larger stake only magnifies the monetary result and drawdown. Variable stakes complicate the analysis because a simple trade-count win rate no longer represents the weight of each outcome.
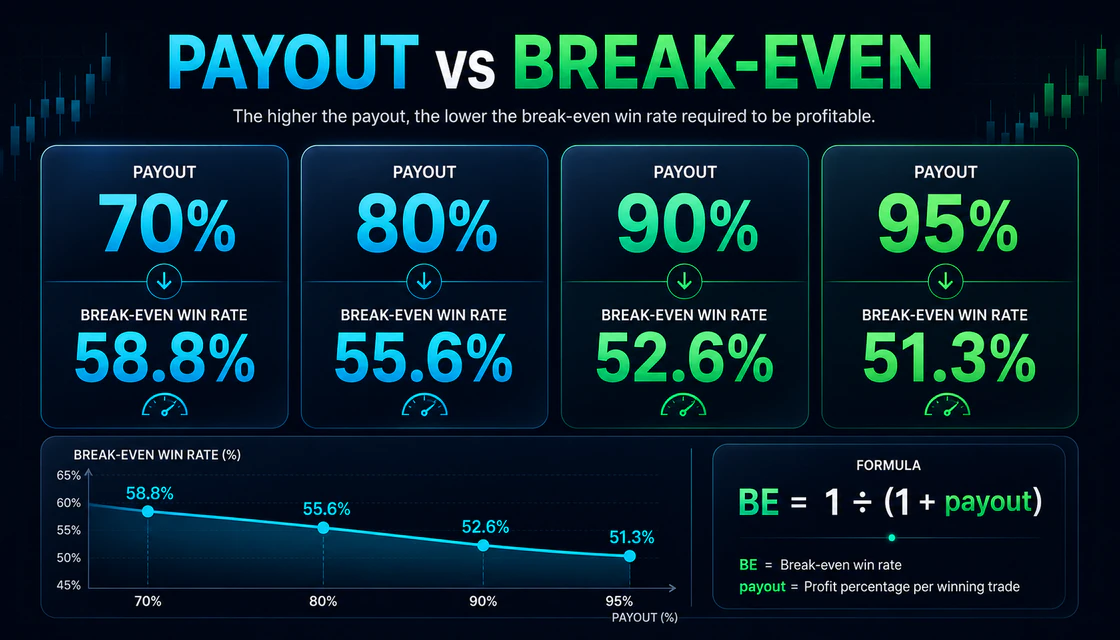
Payout-to-Break-Even Reference Table
A lower payout raises the accuracy hurdle. Even a small payout change matters over a long series.
Whole-trade counts are rounded up. At least describes arithmetic break-even for that exact 100-trade illustration, not a sufficient sample or a profit target.
| Payout | Break-even win rate | Wins needed per 100 trades |
|---|---|---|
| 60% | 62.50% | At least 63 |
| 65% | 60.61% | At least 61 |
| 70% | 58.82% | At least 59 |
| 75% | 57.14% | At least 58 |
| 80% | 55.56% | At least 56 |
| 85% | 54.05% | At least 55 |
| 90% | 52.63% | At least 53 |
| 95% | 51.28% | At least 52 |
How to Calculate Your Result Over a Trade Series
The fastest audit uses one unit of risk per trade. Multiply the number of wins by the payout, then subtract the number of losses. At an 80% payout, 60 wins and 40 losses produce 60 × 0.80 - 40 = +8 units. With 52 wins and 48 losses, the result is 52 × 0.80 - 48 = -6.4 units. The second trader won more often than they lost, yet the series still lost because the reward per win was smaller than the loss per failure.
At an 80% payout, 55 wins still lose one unit; 60 wins produce eight units before additional frictions.
| Wins / losses | Win rate | Result at 80% payout | Interpretation |
|---|---|---|---|
| 52 / 48 | 52% | -6.4 units | More wins than losses, but clearly below break-even |
| 55 / 45 | 55% | -1.0 unit | Close to the threshold, still negative |
| 56 / 44 | 56% | +0.8 unit | Barely above break-even; little room for instability |
| 60 / 40 | 60% | +8.0 units | Positive in this sample under fixed assumptions |

Expected Value per Trade
Expected value converts win rate and payout into an average result per unit staked. The formula is: EV = (win rate × payout) - (loss rate × loss fraction). With a full loss, the loss fraction is 1. A tested win rate of 58% at an 80% payout gives EV = 0.58 × 0.80 - 0.42 × 1 = 0.044 unit per trade. That is +4.4 units per 100 trades if the assumptions hold exactly.
The number is useful because it exposes thin margins. If a method shows +0.01 unit per trade, a small decline in payout or accuracy can erase the result. If the journal mixes 90%, 80% and 65% payouts, using one optimistic headline payout exaggerates expectancy. Calculate with the payout actually available for every recorded trade, or at minimum use a conservative weighted average.
When Payout Changes, the Strategy Changes
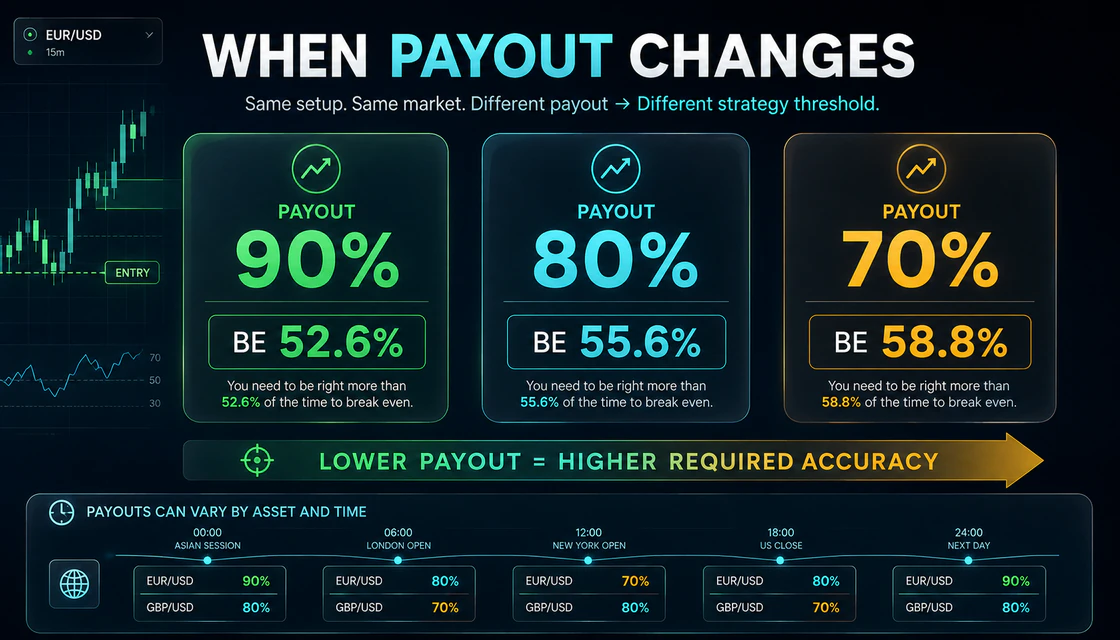
Platforms can display different payouts by asset, session, expiry, account conditions or market availability. A setup tested at 90% is not economically identical when offered at 70%. At 90%, the break-even point is 52.63%; at 70%, it is 58.82%. A historical 56% win rate has positive expectancy in the first case and negative expectancy in the second.
The same setup crosses different mathematical hurdles as payout moves from 90% to 70%. Create a minimum-payout rule before the session. If your validated sample shows 59% accuracy with enough stability at 80% payouts, dropping to 70% leaves almost no theoretical advantage. Skipping is more rational than pretending the contract still has the same economics. Record the displayed payout at entry; do not fill it in later from memory.
- Compare the current payout with the payout distribution in your test sample.
- Separate results by asset and session if payouts or behavior differ materially.
- Do not substitute the platform's maximum advertised payout for the actual trade payout.
- Recalculate expectancy whenever the payout regime changes.
- Treat OTC or weekend instruments as a separate dataset from exchange-sourced market hours.
What If the Broker Offers a Refund on Losses?
Some contract structures may return a fraction of the stake after an unsuccessful result. In that case, the amount lost is less than one full unit. If the refund is 10%, the loss fraction is 0.90. The generalized break-even formula becomes: loss fraction / (payout + loss fraction).
With an 80% payout and a 10% refund, the threshold is 0.90 / (0.80 + 0.90) = 52.94%. This is lower than 55.56% because each failure costs 0.90 unit rather than one unit. Do not assume a refund exists. Verify the exact contract terms and whether the displayed payout already reflects the feature. Platform terms can vary by product and region.
| Winning profit | Loss fraction | Break-even formula | Threshold |
|---|---|---|---|
| 80% | 100% | 1.00 / (0.80 + 1.00) | 55.56% |
| 80% | 90% (10% refund) | 0.90 / (0.80 + 0.90) | 52.94% |
| 70% | 100% | 1.00 / (0.70 + 1.00) | 58.82% |
Why Martingale Does Not Improve the Break-Even Rate
Increasing the stake after a loss changes the distribution of monetary exposure; it does not improve the setup's probability or payout. The underlying contract still has the same negative or positive expected value per unit. A progression may create many small recovery sequences, but one sufficiently long losing run produces a disproportionately large drawdown or reaches the platform and account limits.
It also makes trade-count win rate less informative because later trades carry much more weight. A 60% win rate can still lose heavily if the largest stakes happen to be unsuccessful. For clean validation, use a fixed stake or fixed percentage chosen before the session. Evaluate the strategy first; do not hide weak expectancy behind position sizing.
How Many Trades Are Enough?
There is no magic sample size that proves future profitability. Ten trades are far too sensitive to chance. One hundred trades provide more information, but may still be insufficient when setups occur in different assets, sessions and volatility regimes. The useful question is not only how many, but how comparable the observations are.
A clean sample uses the same setup definition, asset group, timeframe, expiry logic, payout floor and execution rules. If you change all of them, 300 trades can be less informative than 100 controlled observations. Track a rolling win rate and expectancy rather than celebrating one final number. Look for whether results remain above break-even across subperiods instead of being carried by one lucky week.
- Start with at least 100 controlled demo trades as a practical first review point, not final proof.
- Divide the sample into blocks such as 25 trades to see whether performance is stable or concentrated.
- Keep rule-following trades separate from violations.
- Report the payout actually received on every win.
- Continue forward testing after any meaningful rule change; do not merge incompatible versions.
- Expect uncertainty. A small observed edge deserves caution, not immediate stake increases.
A Practical Demo Validation Process
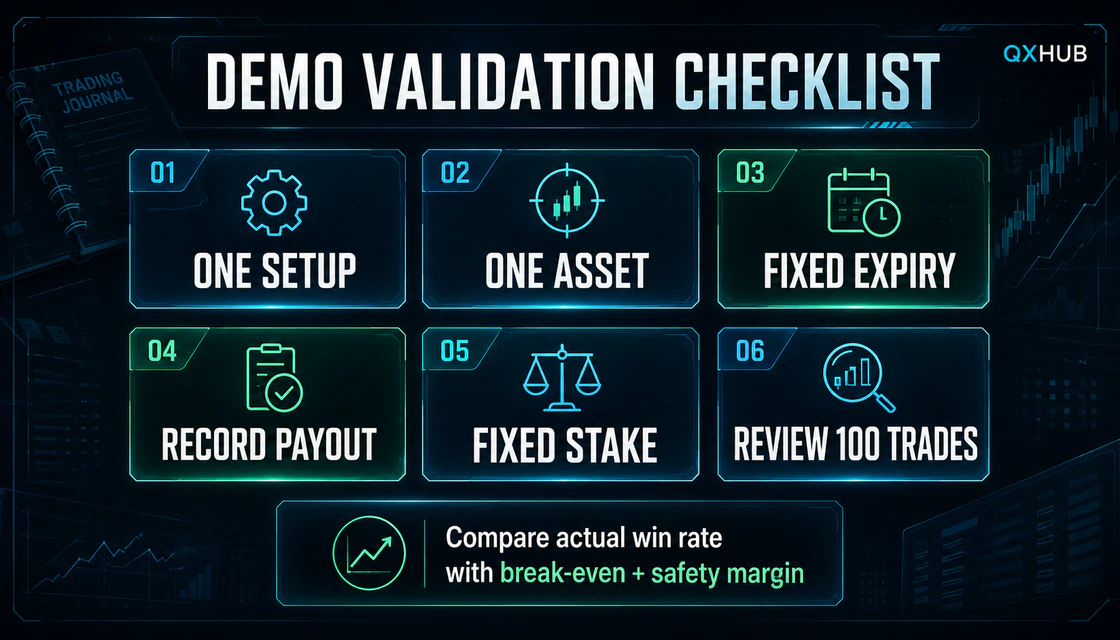
- Define one setup in objective language: market condition, location, trigger, confirmation and invalidation.
- Choose one asset or a tightly related asset group and one trading session.
- Fix the chart timeframe and expiry rule before collecting the sample.
- Set a minimum acceptable payout and record the exact displayed payout at entry.
- Use one fixed training stake. Never use Martingale or recovery trades.
- Record every valid signal, including the inconvenient losses and skipped opportunities.
- After 100 resolved trades, calculate win rate, weighted average payout, total units and expected value.
- Compare rule-following trades with violations, then choose only one change for the next test.
Demo task: collect 100 trades using one setup and a fixed one-unit stake. For each trade record date, asset, session, payout, direction, expiry, result, rules followed and screenshot. Calculate the exact series result rather than using win rate alone. Do not move to real money merely because one sample finishes positive.
Complete Break-Even Review Worksheet
| Metric | Your result | Review question |
|---|---|---|
| Resolved trades | — | Is the sample large and consistent enough to review? |
| Wins / losses | — | Were ties, cancellations and refunds classified correctly? |
| Observed win rate | — | How far is it above or below break-even? |
| Average actual payout | — | Did payouts vary by asset or session? |
| Break-even win rate | — | Was it calculated from the actual payout data? |
| Total units | — | Does the monetary result agree with the win-rate calculation? |
| Expected value per trade | — | Is the margin meaningful or extremely thin? |
| Rule-adherence rate | — | Were positive results driven by repeatable decisions? |
| Worst losing sequence | — | Could the planned stake survive this without escalation? |
When to Skip a Trade Even If the Setup Looks Good
- The current payout is below the minimum used in validation.
- The planned expiry crosses a high-impact economic event.
- The asset or OTC feed was not part of the tested dataset.
- Volatility is materially different from the conditions represented in the sample.
- The entry requires chasing after the confirmation candle has already travelled too far.
- You have reached the session trade cap, daily loss cap or emotional stop condition.
- The payout, strike or expiry cannot be confirmed clearly before the click.
- You are tempted to increase stake to recover a previous loss.
A break-even formula cannot rescue a poor trade. It only evaluates the payoff structure. Entry quality, expiry, market conditions, execution discipline and risk limits remain separate requirements. The strongest mathematical decision may be to reject a low-payout contract even when the chart setup is attractive.
Common Beginner Mistakes
Calling 51% a profitable win rate
With payouts below 100%, 51% is normally below break-even. Calculate the threshold from the actual payout before interpreting accuracy.
Using the maximum advertised payout
The headline number may not be available on the asset, session or expiry traded. Record the value shown for each actual decision.
Ignoring payout changes inside the sample
A simple average can hide that wins occurred at low payouts and losses at other times. Calculate the series in units trade by trade when possible.
Rounding too aggressively
At 80%, the threshold is 55.56%, not simply 55%. Thin edges can disappear through careless rounding. Round for display only after completing the calculation.
Counting demo balance instead of controlled trades
A rising balance can result from variable stakes, bonuses or one oversized trade. Fixed-unit results and a complete journal are more informative.
Optimizing rules after every loss
Changing expiry, setup or asset repeatedly creates a sample that cannot validate anything. Collect a defined block, review it, then change one variable.
Confusing mathematical expectancy with certainty
Positive expectancy describes an average across repeated comparable decisions. It says nothing certain about the next trade and does not prevent long losing sequences.
Risk Management: Turn the Formula Into a Limit
The break-even calculation should reduce risk-taking, not justify larger stakes. Use a small fixed fraction of capital per trade, a daily loss cap, a maximum trade count and a mandatory stop after rule violations. The appropriate amount depends on personal circumstances, but it must be small enough that a normal losing sequence does not force emotional recovery behavior.
Final Advice
The break-even win rate is one of the simplest and most powerful filters in fixed-payout trading. It turns a vague claim such as my strategy wins often into a measurable question: does the observed accuracy exceed the hurdle created by the actual payout, and by enough margin to survive normal variation?
Use the formula before evaluating a strategy, not after losing money. Record every payout, keep stakes fixed during validation, separate rule-following trades from violations and reject contracts whose payout is below the tested minimum. Most importantly, remember what the number cannot do. It cannot predict the next expiry, prove a permanent edge or make an unsuitable platform safe. It can only make your assumptions visible—and visible assumptions are much easier to test honestly.
Quick answers
What win rate is profitable in binary options?
It depends on the payout and loss fraction. With a full loss and 80% payout, the arithmetic break-even rate is 55.56%; a positive sample must finish above that threshold. Profitable should still account for changing payouts, execution and uncertainty.
How do I calculate break-even from payout?
Convert payout to a decimal and calculate 1 / (1 + payout). For 75%, use 1 / 1.75 = 57.14%.
Is a 60% win rate good?
At common payouts of 70–90%, 60% is above theoretical break-even. Whether it is meaningful depends on sample size, actual payout, consistent rules and whether the result persists in forward testing.
Does stake size change the break-even win rate?
Not when each trade uses the same stake. Variable stakes can make a simple trade-count win rate misleading because outcomes carry different monetary weights.
Does Martingale lower the required win rate?
No. It changes stake exposure after outcomes but does not improve the payout or probability of the underlying setup. It can sharply increase drawdown.
Should cancelled or tied trades be counted?
Classify them according to the actual contract settlement. Do not count a returned stake as a win. Keep cancellations, refunds and ties in separate fields so the resolved-trade calculation remains transparent.
Can I use an average payout?
A weighted average based on actual trades is acceptable for a quick review, but trade-by-trade unit calculation is more accurate when payouts vary. Never use a platform's maximum advertised payout as the sample average.
How many demo trades should I test?
One hundred controlled trades is a useful first review point, not proof. Continue testing across comparable periods and inspect subgroups, rule adherence and payout stability.
Next step
Choose a topic by task: brokers for platform selection, guides for access, strategies for setups, risk for discipline and investing for longer market logic.