binary options price action trading
Binary Options Price Action Trading: A Practical Guide for Beginners
Learn binary options price action trading with market structure, key levels, completed candles, confirmation, expiry rules, examples and a seven-day demo plan.

Key points
- Read structure and location before treating any candle as evidence.
- Wait for a completed candle and predefined confirmation instead of reacting to temporary intrabar movement.
- Choose expiry, payout limits and fixed risk before entry, then test one unchanged setup on demo.
Read the Story Before the Signal
Many beginners start chart analysis by searching for a candle name: pin bar, engulfing candle, doji or breakout candle. The shape feels concrete, so it is tempting to treat it as a ready-made signal. The problem is that the same candle can mean very different things depending on where it forms, what the market was doing before it appeared and how much time remains before expiry.
Price action trading solves a more useful problem. Instead of asking, “What does this candle predict?” it asks, “What is the market doing, where is price now, and what would confirm that the current behavior is changing or continuing?” This framework works across currency pairs, commodities, indices, stocks, cryptocurrencies and other assets offered by different platforms. The buttons may change, but open, high, low and close still describe the same price auction.
This guide teaches a broker-neutral workflow. You will learn how to classify market structure, mark decision areas, read candle closes, avoid late entries, match expiry to chart rhythm, calculate the break-even requirement created by payout and practise the entire process on demo. None of these tools predicts the next candle with certainty. Their purpose is to make a trading decision clear enough to test, record and reject when conditions are poor.
What Is Price Action Trading in Binary Options?
Price action is the study of how price moves over time. The raw material is simple: swing highs and lows, candle bodies and wicks, momentum, pauses, breakouts, pullbacks, support, resistance and the relationship between recent candles. Indicators may still be used as secondary evidence, but the trade idea begins with price rather than with an indicator alert.
In a conventional market trade, a trader may manage an open position with a stop or target. A fixed-time or binary options contract is different: the outcome is determined at a specified expiry. That makes timing unusually important. A directionally reasonable idea can still finish out of the money if the entry is late, the expiry is too short for normal noise, or price pauses before continuing.
| Price-action question | What it tells you | Common beginner mistake |
|---|---|---|
| What is the structure? | Trend, range, transition or chaos | Trading every candle as an isolated event |
| Where is price? | At a tested level, in open space or in the middle | Entering in the middle of nowhere |
| Did the candle close? | Whether rejection or breakout actually completed | Reacting to a wick before the candle closes |
| What confirms the idea? | Follow-through, retest, momentum or level hold | Using one candle as complete proof |
| Does expiry fit? | Whether the idea has enough time to develop | Copying one universal expiry |
| What invalidates the setup? | The condition that means skip | Forcing a trade after context changes |
The Five-Layer Price Action Framework
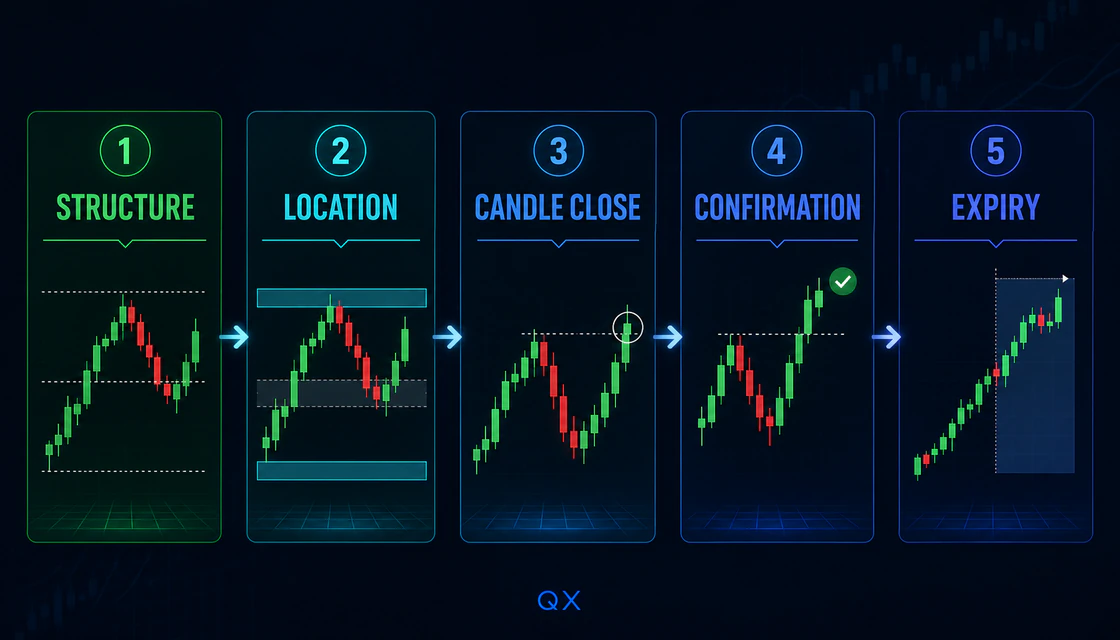
1. Structure: define the market state
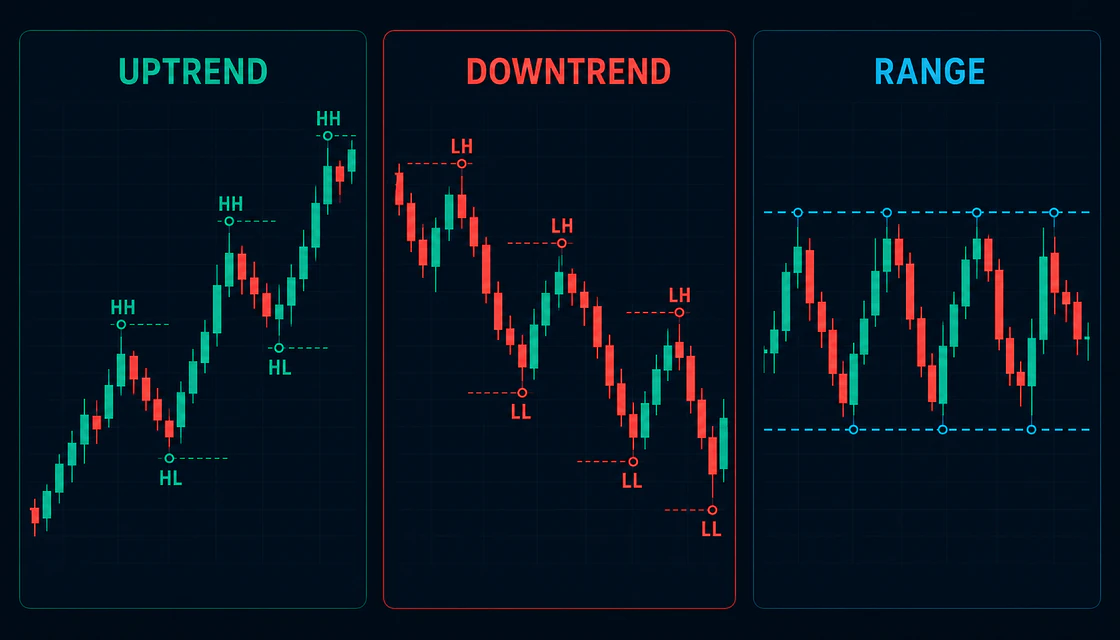
Start by zooming out enough to see several completed swings. An uptrend generally produces higher swing highs and higher swing lows. A downtrend generally produces lower swing highs and lower swing lows. A range repeatedly rotates between horizontal boundaries. A transition appears when the previous sequence weakens or breaks but a new sequence is not yet established.
Structure is a filter, not an entry. It tells you which ideas deserve attention. In a stable uptrend, pullbacks toward support may be more coherent than random downward bets. In a range, entries near the edges make more sense than entries near the centre. In a transition, patience is often more valuable than choosing a side early.
2. Location: make the candle earn its meaning
A useful signal should form at a useful place. Common locations include a previously respected support or resistance zone, a broken level being retested, a trendline area that also aligns with horizontal structure, or the outer edge of a clear range. Treat levels as zones rather than perfect single-price lines: real markets frequently overshoot, test and return.
The centre of a range is usually poor location because neither side has a clear structural advantage. Likewise, a reversal candle that forms after price has already travelled far from its level may be visually attractive but operationally late. Location removes many weak trades before candle analysis begins.
3. Candle close: separate evidence from animation
An active candle changes shape until it closes. A long lower wick can disappear if sellers regain control; a breakout body can collapse back inside the range. Waiting for the close reduces the temptation to treat temporary movement as confirmed information. The close does not guarantee follow-through, but it creates a stable observation that can be recorded and tested.
4. Confirmation: require the market to agree
Confirmation is evidence beyond the first attractive candle. It might be a second candle holding above a broken level, a retest that fails to move back through the zone, renewed momentum in the direction of the structure, or a clean rejection followed by a close away from the boundary. Define confirmation before the session. If you invent it after seeing the result, your backtest becomes unreliable.
5. Expiry: match time to the setup
Expiry should be connected to the chart timeframe and the normal duration of the move being traded. A pullback-and-continuation setup may need several candles to develop, while an extremely short expiry can be dominated by ordinary fluctuations. There is no universal multiplier that works for every asset, session and broker feed. Test one explicit rule on demo, such as an expiry measured in a fixed number of chart candles, and keep it unchanged while collecting a meaningful sample.
How to Read Candles Without Memorizing Dozens of Patterns
A candlestick displays four values for its period: open, high, low and close. The body shows the distance between open and close; the wicks show the extremes. CME Group’s chart education explains that larger bodies reflect greater movement during the period, while small bodies show that open and close were close together. This is useful description, not a forecast.
Read each candle through four questions:
- • Position: did it form at a meaningful level or in random space?
- • Close: did it finish near an extreme, back inside a range, or through a level?
- • Relative size: is it unusually large compared with recent candles, or normal for the current rhythm?
- • Follow-through: did the next completed price action confirm or immediately reject the message?
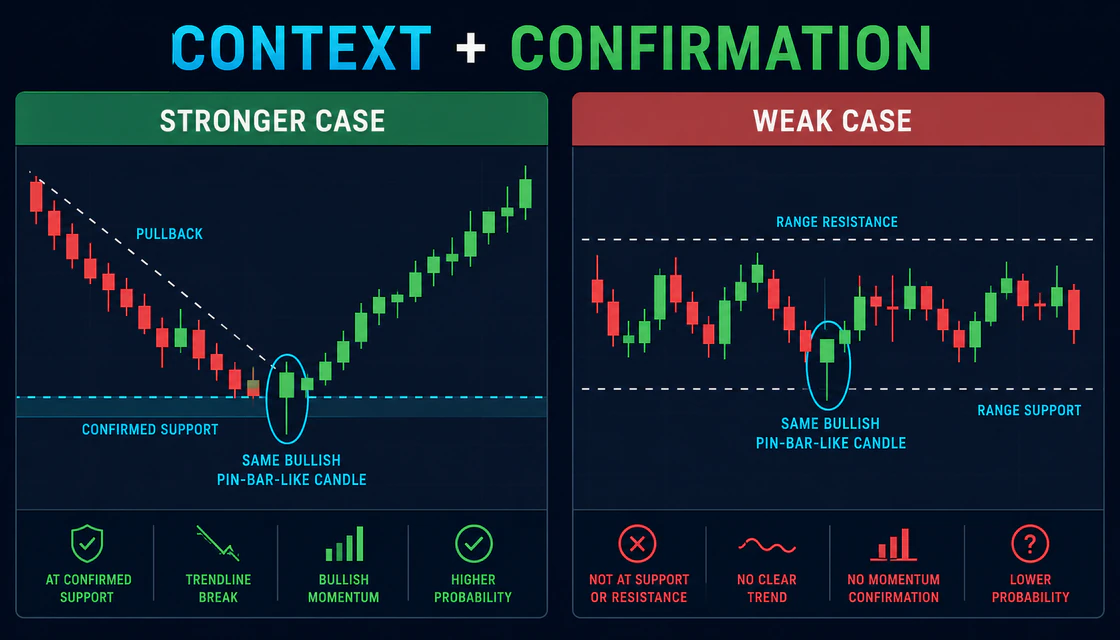
A long wick at support can show rejection, but it can also be ordinary volatility. A large bullish body through resistance may show expansion, but if it is the third oversized candle after a long run, entering immediately may mean chasing exhaustion. A small doji at the centre of congestion often means very little. The pattern name is less important than the market question it answers.
Two Price Action Setups to Test on Demo
Setup A: Trend Pullback and Continuation
This setup looks for a temporary move against an established trend, followed by evidence that the dominant direction is resuming. It avoids buying after a long bullish expansion or selling after an extended bearish fall.
- Confirm a readable sequence of higher highs and higher lows for an uptrend, or lower highs and lower lows for a downtrend.
- Mark the nearest previously respected support or resistance zone.
- Wait for price to pull back into the zone without destroying the broader structure.
- Require a completed rejection or continuation candle and a predefined confirmation rule.
- Check the economic calendar, volatility, current payout and whether the planned expiry fits the tested chart rhythm.
- Skip if the pullback becomes a structural break, the confirmation arrives after a large chase candle, or the level is no longer clear.
Example EUR/USD is forming higher highs and higher lows on a five-minute chart. Price returns to a previous resistance zone that has begun acting as support. A candle closes above the zone after rejecting lower prices, and the next candle holds the level. This creates a testable continuation case. It does not prove that the next move will rise; it only satisfies a predefined set of conditions.
Setup B: Range-Edge Rejection
This setup is designed for a stable horizontal market. It requires repeated respect of both range boundaries and rejects entries in the middle. The logic becomes invalid when momentum closes decisively outside the range or major news changes volatility.
- Identify at least two clear reactions from the upper and lower boundaries.
- Wait until price reaches an edge; do nothing in the middle third of the range.
- Look for a completed rejection that closes back inside the boundary.
- Require follow-through away from the edge or a failed attempt to break it again.
- Use the same tested expiry and fixed stake rule for every sample trade.
- Skip narrow, erratic ranges, repeated boundary piercing, news expansion and declining payout.
When to Skip a Price Action Trade
The no-trade rule is part of the strategy, not an absence of strategy. A useful system rejects more situations than it accepts. Skip when any of the following applies:
- • Structure is mixed: swings overlap and direction changes every few candles.
- • Price is in the middle of a range or too far from the level that justified the idea.
- • The signal candle is still open or confirmation requires chasing a large move.
- • A high-impact release is near enough that the planned expiry crosses the event window.
- • Current payout is below the minimum used in your test sample.
- • The broker’s OTC or weekend feed behaves differently from the market conditions you tested.
- • You have reached the daily trade cap, loss cap or emotional stop condition.
- • You cannot state the setup, confirmation and invalidation in one short sentence.
Price Action and Expiry: Why Direction Is Not Enough
Imagine that support holds and price eventually rises, but it spends three candles retesting the zone first. A very short contract may expire during the retest even though the broader reading was reasonable. A much longer expiry can introduce a different problem: the market may reach another level, reverse or encounter scheduled news before settlement.
Build expiry rules from observation rather than folklore. Record how many candles a typical impulse and pullback last on the selected asset and session. Test one chart timeframe, one setup and one expiry definition. Do not optimize the expiry after every loss; that creates a rule that explains history without proving it can be followed forward.
| Expiry mistake | Why it fails | Better rule |
|---|---|---|
| Ultra-short expiry on a slow setup | Normal noise dominates the outcome | Allow the tested setup enough candles to develop |
| Long expiry across major news | The original context may be replaced by event volatility | Exclude expiries that cross restricted news windows |
| Changing expiry after entry | The test is no longer consistent | Choose expiry before the trade |
| Copying another asset’s timing | Each asset and session has a different rhythm | Validate by asset, session and timeframe |
Risk Management and Payout Mathematics
Good chart reading cannot repair poor risk control. Binary options have an asymmetric payoff: a losing trade can cost the entire stake, while a winning trade usually returns less than the stake as profit. That means the break-even win rate depends on payout.
Use a small fixed percentage or fixed training stake defined before the session. Never increase the next stake to recover a loss. Martingale changes exposure after an outcome; it does not improve the quality of the price-action setup and can accelerate drawdown. Pair the chart rule with a maximum number of trades, a daily loss limit and a stop after rule violations.
Binary options availability and legal treatment differ by jurisdiction. The CFTC warns that many internet-based, off-exchange platforms are unregistered and may expose customers to fraud, withdrawal problems or software manipulation. Verify whether the product and provider are permitted where you live, check registration where applicable and never trade money you cannot afford to lose.
A Complete Pre-Trade Price Action Checklist
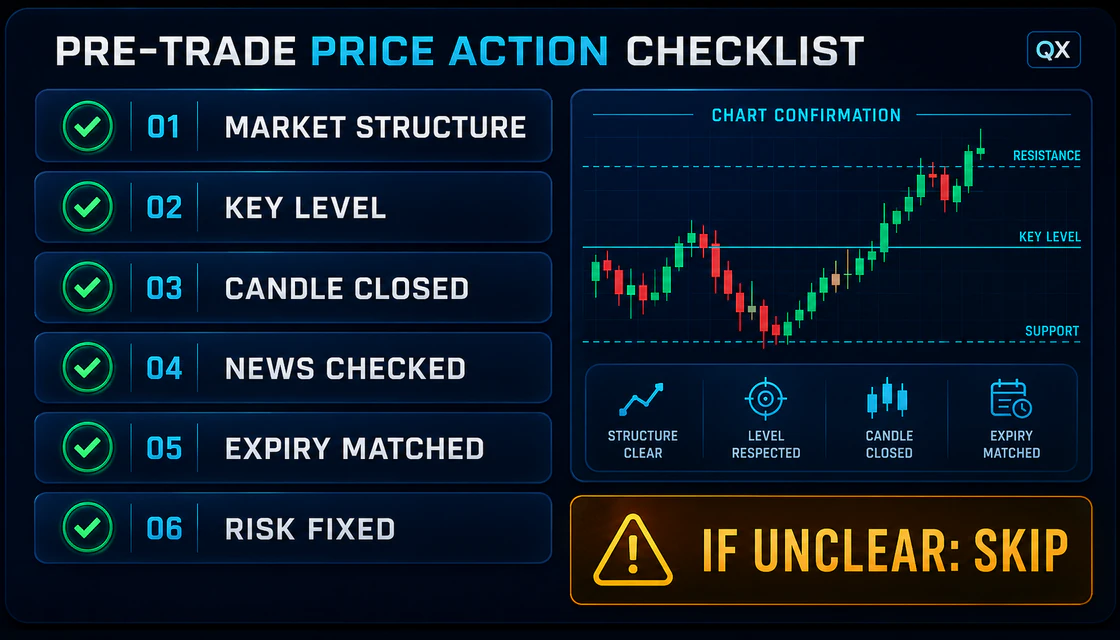
If one essential condition is unclear, waiting protects both the account and the integrity of the test.
| Check | Pass condition |
|---|---|
| Market structure | Trend or range is visible; transition and chaos are excluded |
| Location | Price is at a tested level, range edge or valid retest zone |
| Candle close | The evidence is based on a completed candle |
| Confirmation | A predefined follow-through or retest rule is satisfied |
| Volatility | Candles are active but readable; no abnormal spike or dead market |
| News | Expiry does not cross a restricted high-impact event window |
| Payout | Current payout meets the minimum used in testing |
| Expiry | Chosen before entry and consistent with the tested rule |
| Risk | Stake, trade cap and loss cap are fixed before the click |
| Emotional state | No revenge, urgency, fatigue or recovery objective |
Common Beginner Mistakes
Treating a pattern as a prediction
A candle describes what happened during one period. It does not promise the next period. Require structure, location and confirmation.
Drawing too many levels
If every price is support or resistance, no level can filter a trade. Keep only the zones that produced clear reactions and remain relevant to the current structure.
Entering before the candle closes
An unfinished wick or breakout can reverse. Use completed information unless your tested rules explicitly define an intrabar method.
Chasing confirmation
Confirmation can arrive too late. If price has already travelled most of the expected move, the correct response may be to miss the trade.
Changing several variables together
Switching the asset, timeframe, expiry and confirmation rule after a few losses makes the results impossible to interpret. Change one variable only after a documented review.
Judging quality by win or loss
A valid setup can lose and an impulsive trade can win. Score rule adherence separately from the result so luck does not rewrite the lesson.
Seven-Day Demo Practice Plan
Do not treat seven days as proof that a setup is profitable. The goal is operational: can you identify the same conditions, follow the same rules and record every valid signal without deleting inconvenient examples? Continue forward testing until the sample covers different sessions and market conditions.
| Day | Exercise | Deliverable |
|---|---|---|
| 1 | Classify 30 chart snapshots as uptrend, downtrend, range or unclear | Structure accuracy sheet |
| 2 | Mark only the two most relevant zones on 20 charts | Clean level screenshots |
| 3 | Compare active candles with their final closed shape | 10 before-and-after examples |
| 4 | Collect 10 valid and 10 invalid trend-pullback examples | Setup library with reasons |
| 5 | Collect 10 range-edge examples and reject all middle entries | Range checklist |
| 6 | Run the full checklist on demo with fixed expiry and fixed stake | Trade journal entries |
| 7 | Review rule adherence, late entries, skipped trades and screenshots | One rule to keep; one issue to retest |
How to Review a Price Action Sample
Separate process metrics from outcome metrics. First count how often you followed every rule, how often you entered late, how many trades occurred away from a level and how many planned trades were correctly skipped. Then group results by setup, asset, session, payout band and expiry rule. A single overall win rate can hide the fact that one version of the setup was tested under completely different conditions.
Use the following review loop: Observation → Evidence → Possible cause → One controlled change → New forward test. For example: “Late entries lost clarity” is an observation. Screenshots showing confirmation after oversized candles are evidence. A possible cause is a confirmation rule that reacts too slowly. Test one revised rule on a new sample without editing the old records.
Final Advice
Price action becomes practical when it reduces decisions. Start with structure, wait for price to reach a meaningful location, use completed candles, demand predefined confirmation, choose expiry before entry and keep risk fixed. If the story is unclear, do not add indicators until it looks convincing. Skip the trade.
The strongest beginner exercise is not finding more patterns. It is learning to recognize the same setup, under the same conditions, often enough that the rules can be tested honestly. A good method does not make every chart tradable. It makes the difference between evidence and temptation easier to see.
Quick answers
Is price action good for binary options?
It can provide a clear, testable way to read structure and timing, but it cannot remove uncertainty. Its usefulness depends on objective rules, payout, expiry, risk control and honest testing.
Can I trade price action without indicators?
Yes. Price action can be used alone, although a simple indicator may serve as secondary context. Avoid adding tools that duplicate the same information or replace the reason for the trade.
What is the best price action pattern?
There is no universal best pattern. A simple rejection or continuation candle at a meaningful level can be more useful than a complex pattern in random chart space.
Which timeframe is best for price action?
The best timeframe is the one on which structure is readable and your setup and expiry have been tested. Very short charts often contain more noise, but no timeframe guarantees better results.
Should I enter as soon as a pin bar appears?
No. Wait for the candle to close, confirm its location and apply the predefined follow-through rule. A pin-bar shape in the middle of congestion is not automatically a setup.
How many confirmations should I use?
Use the smallest number that makes the rule objective. Too many confirmations can produce late entries. Structure, level, candle close and one follow-through rule are a practical starting framework to test.
Does price action work on OTC assets?
OTC or weekend feeds can behave differently from exchange-sourced market hours. Treat them as a separate dataset and never assume rules validated on regular sessions transfer unchanged.
How long should I test a setup on demo?
Long enough to collect a consistent sample across different conditions. Do not set a calendar deadline as proof. Define the sample, keep the rules fixed and review process quality before considering any real-money use.
Can price action guarantee a profitable trade?
No. Every setup can fail. Price action organizes evidence; it does not predict the next candle with certainty or guarantee profit.
Next step
Choose a topic by task: brokers for platform selection, guides for access, strategies for setups, risk for discipline and investing for longer market logic.